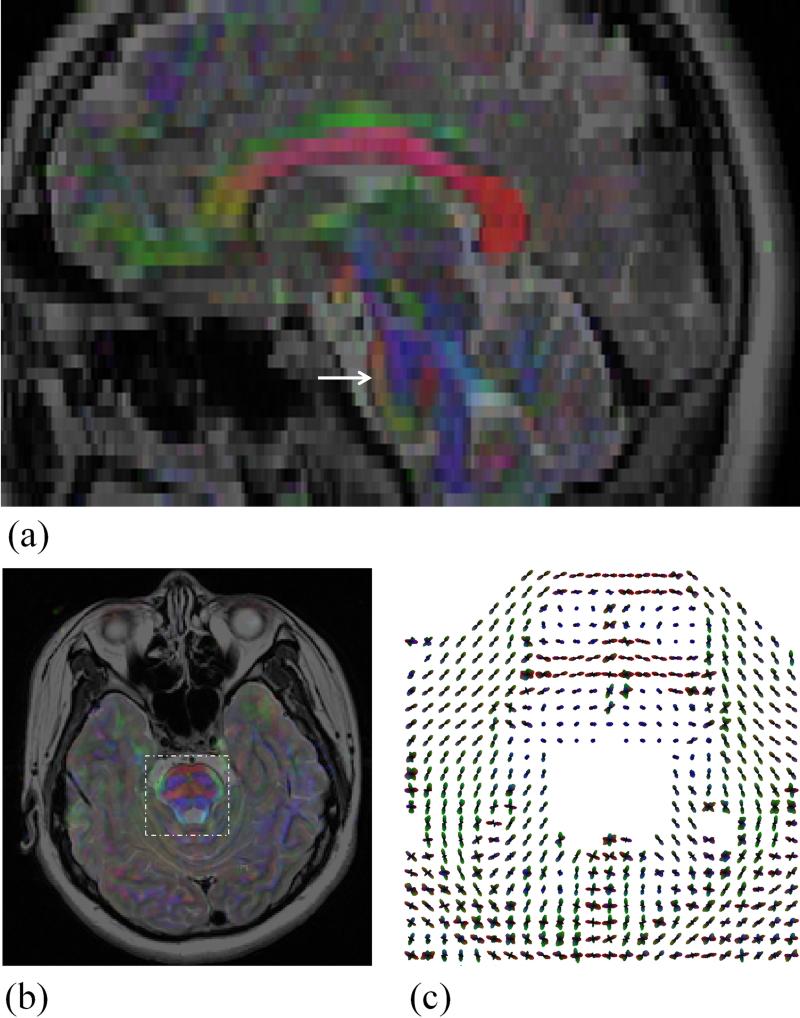
Fig. 7.
The color FA maps are overlaid on the corresponding T2-weighted images both in a reformatted sagittal plane and an axial plane for visual comparisons to indicate the good geometrical fidelity for the DWI results (Subject #6, 48 directions). An arrow in the sagittal slice marks the location of the axial slice, and a dashed box in the axial slice depicts the ROI used for the ODF display.

