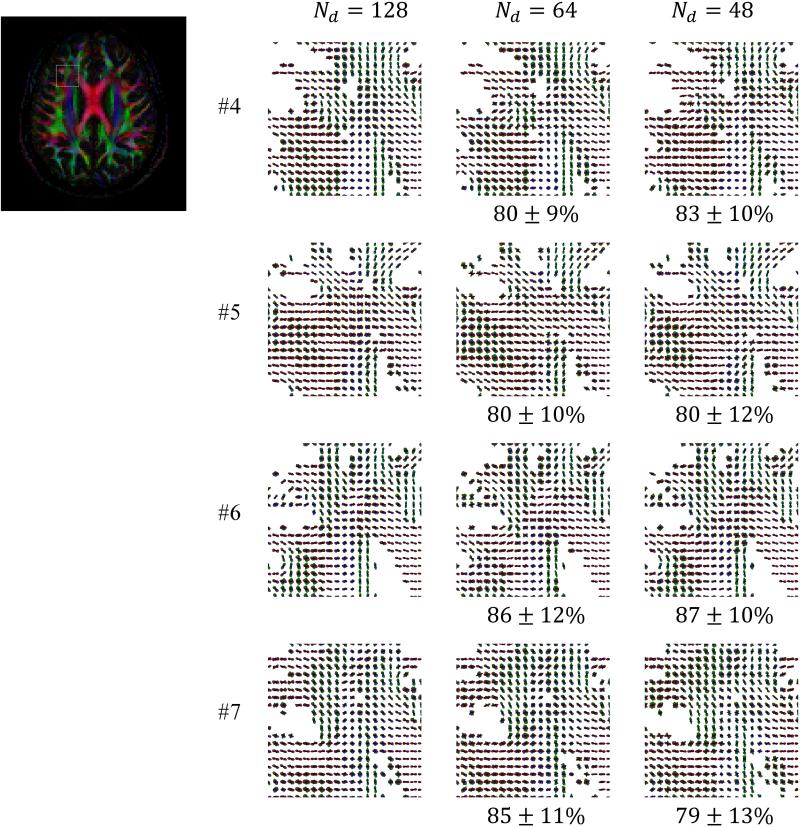
Fig. 8.
ODF maps are shown for the indicated ROI for all four subjects imaged with acceleration, i.e., not fully sampled: The k-space acceleration Rk was equal to 4, and the number of diffusion directions varied from 128 down to 48. The selected ROI contained white matter fibers from the Anterior Corona Radiata (ACR), Corpus Callosum (CC) and short association tracts (SAT). Results obtained with 128 sampled directions were used as a reference standard for similarity index measurements. The overall mean ODF similarity measure inside the ROI remained near or above 80%.

