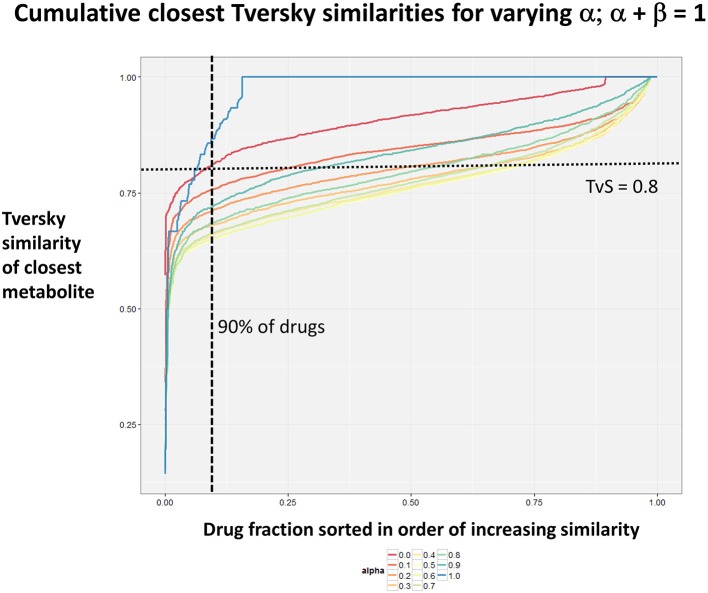
Figure 3.
Cumulative plot of drug-endogenite likenesses using varying values of the Tversky similarity coefficient α with the constraint α + β = 1. For each curve, the maximum Tversky similarity to any metabolite for each drug is plotted in rank order, starting from the right. It is obvious that, especially for values of α closest to 0 or 1, there is an endogenite that is really very similar to the interrogating drug, and much more similar than those found (O'Hagan et al., 2015) when the metric is the Tanimoto similarity.

