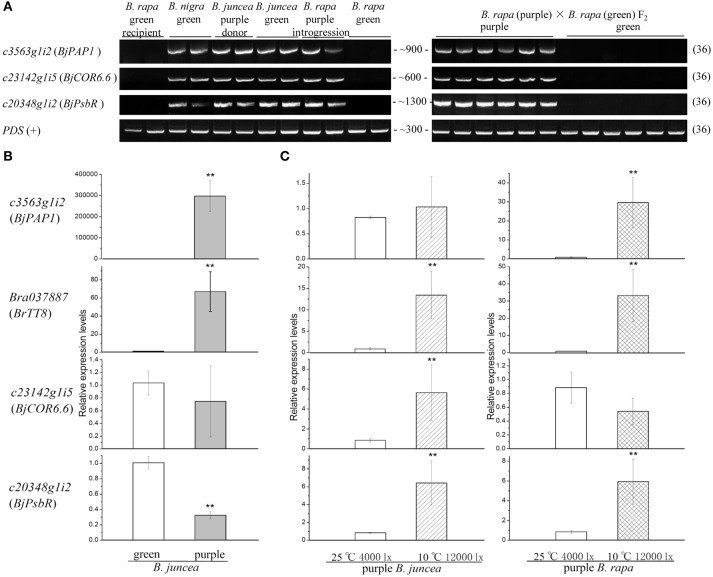
Figure 8.
PCR and qPCR validation of candidate transcripts. (A) PCR amplification (all 36 cycles) of candidate genes from different lines. PDS was used as a positive control. (B) Relative expression levels of green and purple B. juncea (eEF1Bα2 was used as an internal control). (C) Relative gene expression levels under cold and high light treatment (eEF1Bα2 was used as an internal control). **Means statistically significant.

