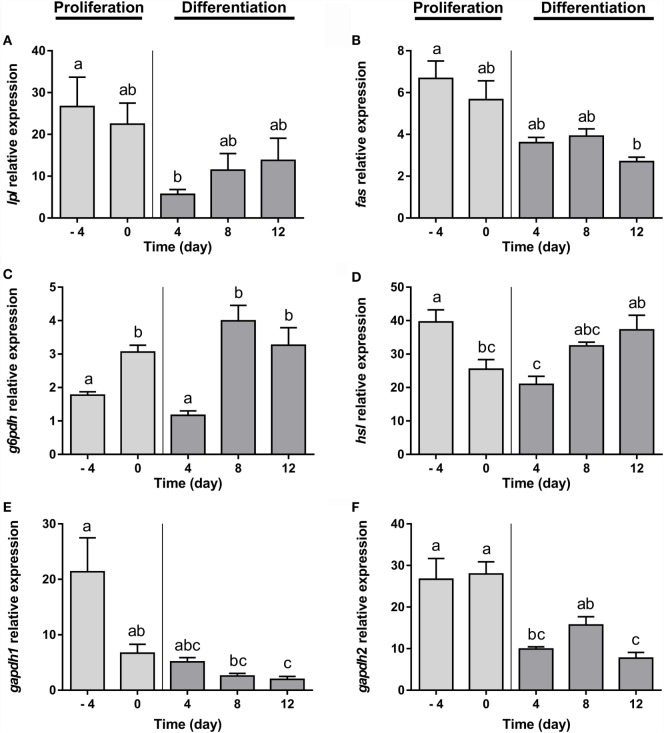
Figure 1.
Gene expression profile of lipid metabolism-related genes in gilthead sea bream preadipocytes during adipogenesis. The mRNA levels of lpl (A), fas (B), g6pdh (C), hsl (D), gapdh1 (E), and gapdh2 (F) were measured by quantitative real-time PCR and normalized to ef1α and rps18. Samples were taken from preadipocytes (days −4 and 0 of culture) and differentiated adipocytes (days 4, 8, and 12 of culture). Values are means ± SEM, n = 4–5. Bars with different letters are significantly different (P < 0.05). lpl, lipoprotein lipase; fas, fatty acid synthase; g6pdh, glucose-6-phosphate dehydrogenase; hsl, hormone-sensitive lipase; gapdh1 and 2, glyceraldehyde 3-phosphate dehydrogenase 1 and 2, respectively; ef1α, elongation factor 1 alpha; rps18, ribosomal protein S18.

