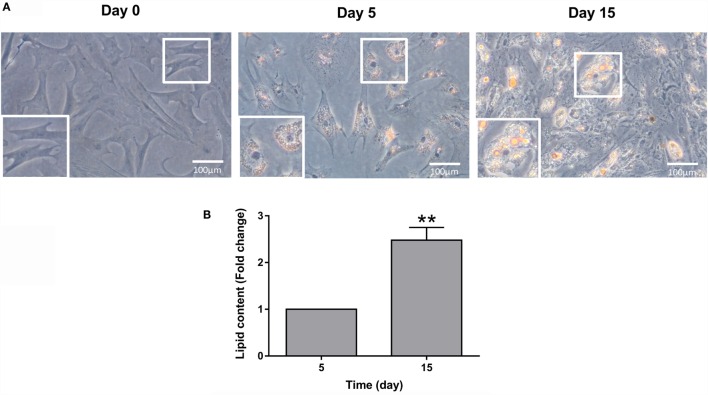
Figure 4.
Gilthead sea bream bone-derived cells during adipogenesis. (A) Representative phase-contrast images of cells stained with Oil red O at days 0, 5, and 15 of culture. Magnification 20× and enlarged views. (B) Quantification of Oil red O staining at days 5 and 15 of culture. Values are mean ± SEM of five independent experiments with wells run in duplicate and presented as fold change relative to day 5 of culture (**P < 0.01).

