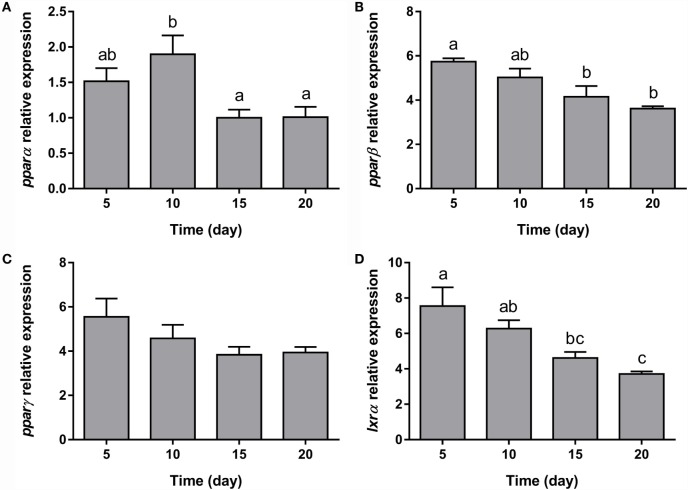
Figure 6.
Gene expression profile of transcription factors in gilthead sea bream bone-derived cells during adipogenesis. The mRNA levels of pparα (A), pparβ (B), pparγ (C), and lxrα (D) were measured by quantitative real-time PCR and normalized to ef1α and rps18. Samples were taken from adipocyte-like cells at days 5, 10, 15, and 20 of culture. Values are means ± SEM, n = 5–6. Bars with different letters are significantly different (P < 0.05). pparα, β, and γ, peroxisome proliferator-activated receptor alpha, beta, and gamma, respectively; lxrα, liver X receptor alpha; ef1α, elongation factor 1 alpha; rps18, ribosomal protein S18.

