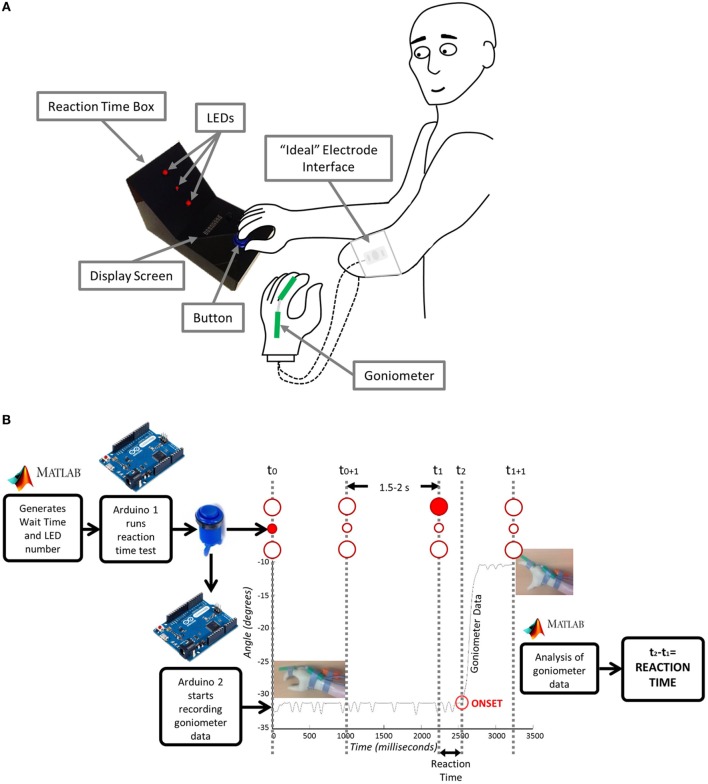
Figure 2.
Reaction time test: (A) Experimental setup and (B) underlying instrumentation. Matlab generates the wait time and LED number and sends them to Arduino1 which starts the test. The user acknowledges that they are ready by pressing the button. The goniometer begins recording and the central LED lights up for 1 s. After a period of 2.5–3 s, one of the larger LED’s lights up and the user moves their hand. Arduino2 connected to the goniometer sends the movement data to Matlab where it is analyzed and a reaction time is sent back to the user.

