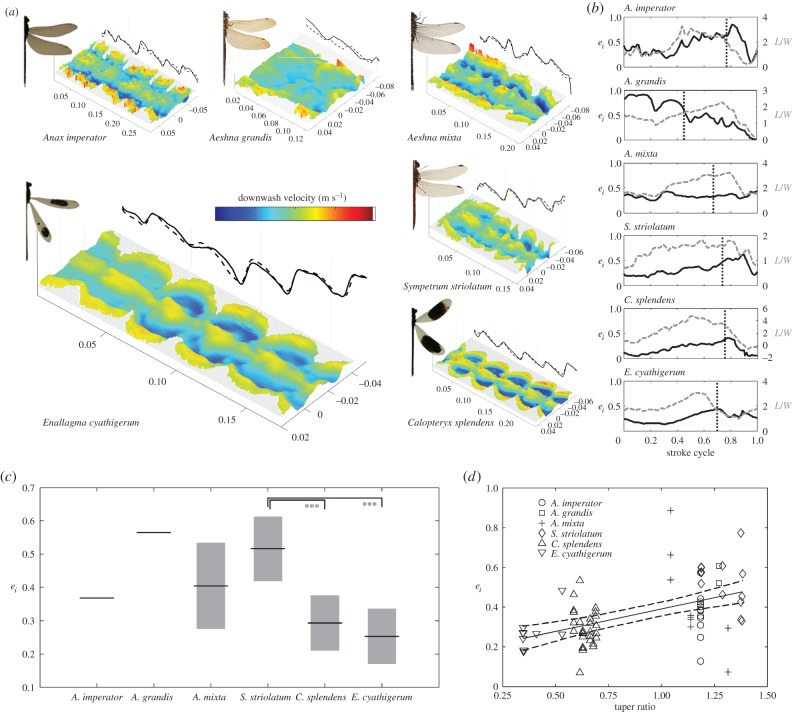
Figure 5.
The wake behind six species of Odonata and their span efficiency. (a) Example sequences of the time-resolved induced downwash of each of the six species. Both the relief and colour represent downwash velocity, with shades in blue/cyan representing downward velocities corresponding to positive lift and shades in red/yellow upward velocities corresponding to negative lift. The ranges of the colour bar are scaled to [−1 1] (m s−1) for the Zygoptera and [−2 2] for the Anisoptera. Note the substantial upwash from wing root vortices close to the centreline of the petiolated Zygoptera, but a more consistent downwash profile across the span in the Anisoptera. Solid and broken lines projected onto the far side of the plot show the vertical excursion of the two tip vortices from hindwing and thus the wing stroke cycle. (b) Time series of the span efficiency (black) and weight support (grey) through the ensemble-averaged wingbeat of each species beginning at pronation of the hindwings. Vertical dotted lines show the transition from downstroke to upstroke. (c) The span efficiency of each species. Boxes show median values with 95% confidence intervals. Post hoc pairwise ANOVA under Tukey criterion shows difference between Sympetrum striolatum and two of the Zygoptera are significant (p < 0.001). (d) The taper ratio is positively correlated with span efficiency (p < 0.001, R2 = 0.24). Solid and dashed lines show the least-squares regression slope with 95% confidence intervals.

