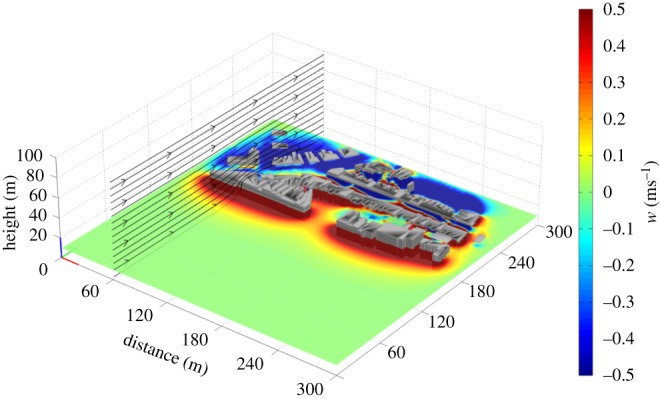
Figure 5.

The vertical wind vector component (w, indicated with a colour scale) within the study site, at a height of 10 m above ground level and with a wind input of 7 ms−1 and a direction of 141°. This illustrates the variability of the flow field and the volume of the downdraughts in relation to the updraughts. The colour scale has been limited to ±0.5 ms−1 (just above the minimum sink rate) to highlight the area available for gliding flight at a sustained altitude.
