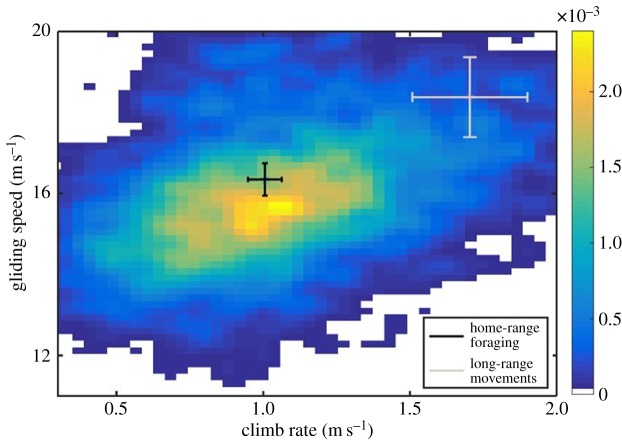
Figure 2.
Probability–density plot of the daily gliding ground speed, as a function of the daily climb rate during thermal soaring (yellow colours represent higher probabilities). The 95% confidence intervals around the mean for home-range foraging (black) and long-range movements (grey) are presented. The figure is based on the low-resolution dataset collected in Israel.

