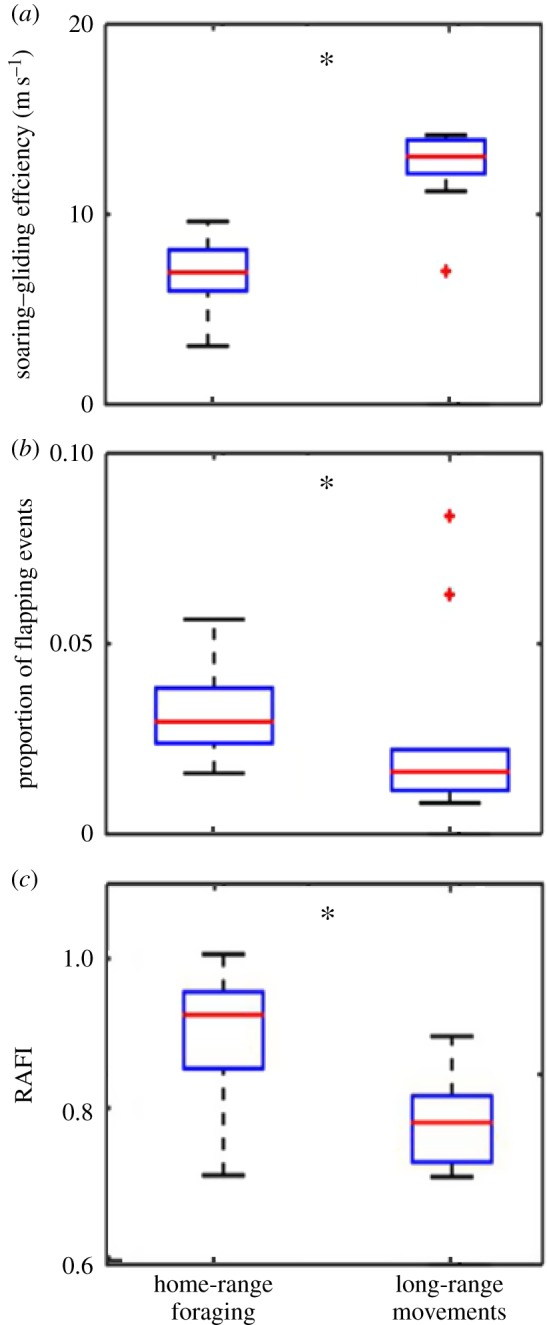
Figure 3.

Differences in time-, energy- and risk-related proxies for soaring–gliding decision-making between two large-scale movement phenomena. (a) Soaring–gliding efficiency measured by dividing cross-country distance during inter-thermal glides by the time soaring in thermals; (b) proportion of flapping events and (c) the estimated RAFI (higher values indicate risk-averse flight behaviour). The boxplots represent averaged individual data of daily means with population median (red line), 1.5 interquartile distance (whiskers) and outliers (red crosses). See table 3 for statistical modelling of these currencies (asterisks indicate significant statistical differences with p < 0.05). The figure is based on the low-resolution dataset.
