Figure 4.
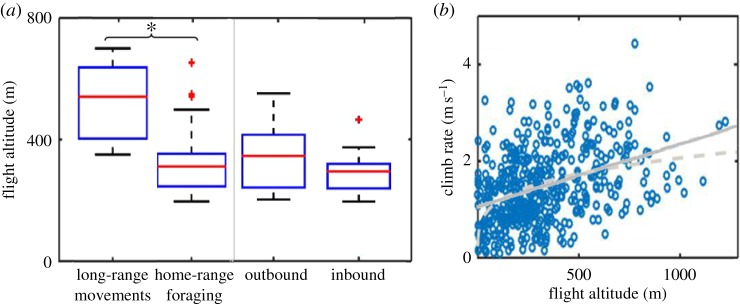
Variation in flight altitude above ground across different scales. (a) During long-range movements individuals showed higher mean flight altitude compared to home-range foraging movements (large-scale analysis based on the low-resolution dataset). No significant differences were found between the movement phases (inbound and outbound flights, based on intermediate scale analysis of the high-resolution dataset). The boxplots represent averaged individual data of daily means with median (red line), 1.5 interquartile distance (whiskers) and outliers (red crosses). Asterisks indicate significant statistical differences. (b) A positive trend was observed between flight altitude and climb rate at thermal soaring elements (based on the high-resolution dataset). The solid line is a linear fit and the dashed line is a power-law fit.

