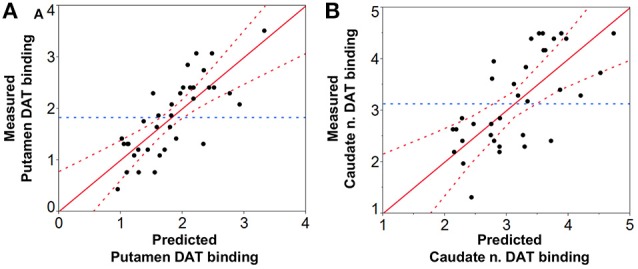
Figure 6.

Prediction analysis of DAT binding values of the (A) putamen and (B) caudate nucleus based on NM-MRI findings. Prediction of DAT binding values was significant for both the putamen (p < 0.0001, R2 = 0.61, RMSE = 0.48, PRESS = 9.33) with SN volume being the best predictor (p < 0.0001) (CNRSN leverage: p = 0.22, and CNRLC leverage: p = 0.29), and the caudate nucleus (p < 0.0001, R2 = 0.50, RMSE = 0.73, PRESS = 21.53) again with SN volume as the best predictor (p < 0.01) (CNRSN leverage: p = 0.11, and CNRLC leverage p = 0.32). RMSE = Root mean square error; PRESS = Predicted residual error sum of squares.
