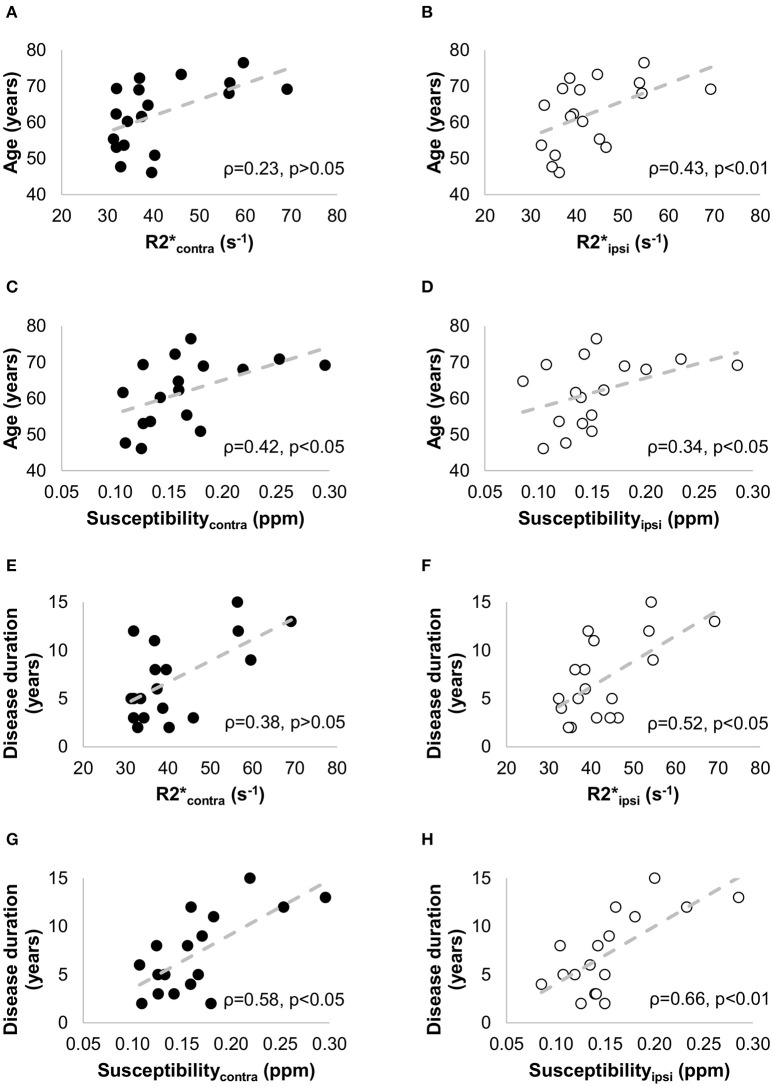
Figure 7.
Non parametric correlation analysis with linear regression between the clinical data [age (A–D) and disease duration (E–H)] and the iron-sensitive imaging measures [R2* (A,B,E,F) and susceptibility (C,D,G,H)] in -patients with PD. The Spearman correlation coefficients (ρ) and the p-values are indicated in each figure. The filled circles correspond to the measurements in the contralateral side, and the empty circles to the measurements in the ipsilateral side.

