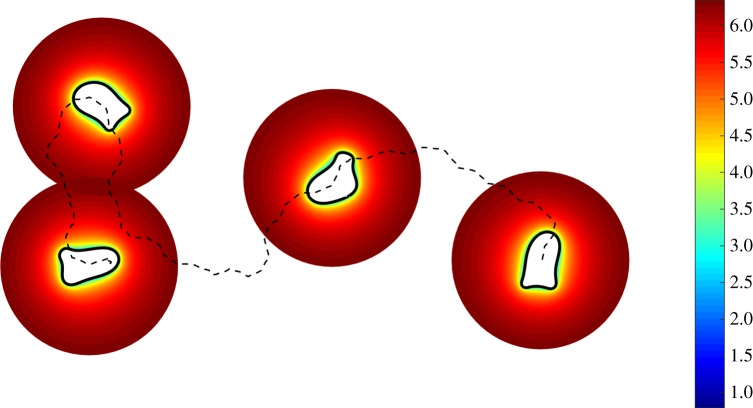
Figure 8.
Cell migration in an initially saturating homogeneous ligand field. Four time frames show the position of the cell membrane and ligand field in the extracellular region. Membrane-bound enzyme degradation results in a depletion zone close to the cell. The dotted line shows the trajectory of the cell centroid and the ligand concentration has been plotted on a log scale.

