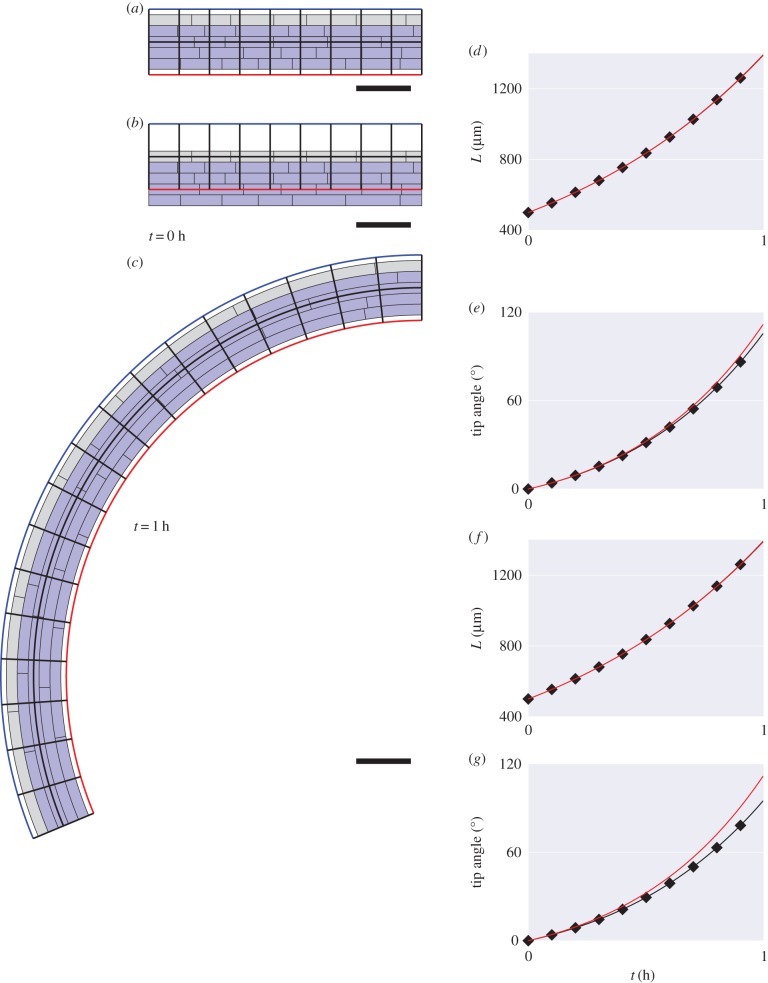
Figure 4.
Bending through differences in cell-wall viscosity. (a) Initial artificial geometry with five files of cells. The uppermost file has (grey) lower viscosity ( ) relative to the other cells (blue,
  ). The discretized midline is overlaid with black lines between red and blue boundaries indicating cross-sectional orientations. (b) Same geometry as (a) but with midline offset from centre of the organ. (c) Simulation at
  . Length (d) and tip angle (e), with midline at the organ centre (red) or offset (black with diamonds). (f,g) Comparison of midline (red) and vertex-element (black with diamonds) simulations (based on [11]). Scale bar,
  .
.

