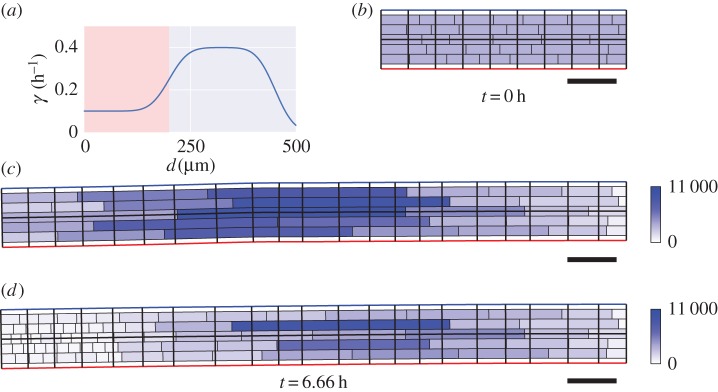
Figure 6.
Simulations with axial variation in cell-wall properties. (a) Elongation rate  as a function of the distance
  from the organ tip. (b) Initial artificial geometry (as in figure 4). The organ is anchored (
 ,
,  ) at its right-hand end, and the tip of the organ (
 ,
,  ) is at the left. (c) Simulation at
  . (d) Simulation with cell division (within the pink region of (a)). Colour bars indicate cell areas (
 ). Scale bar,
  .
.

