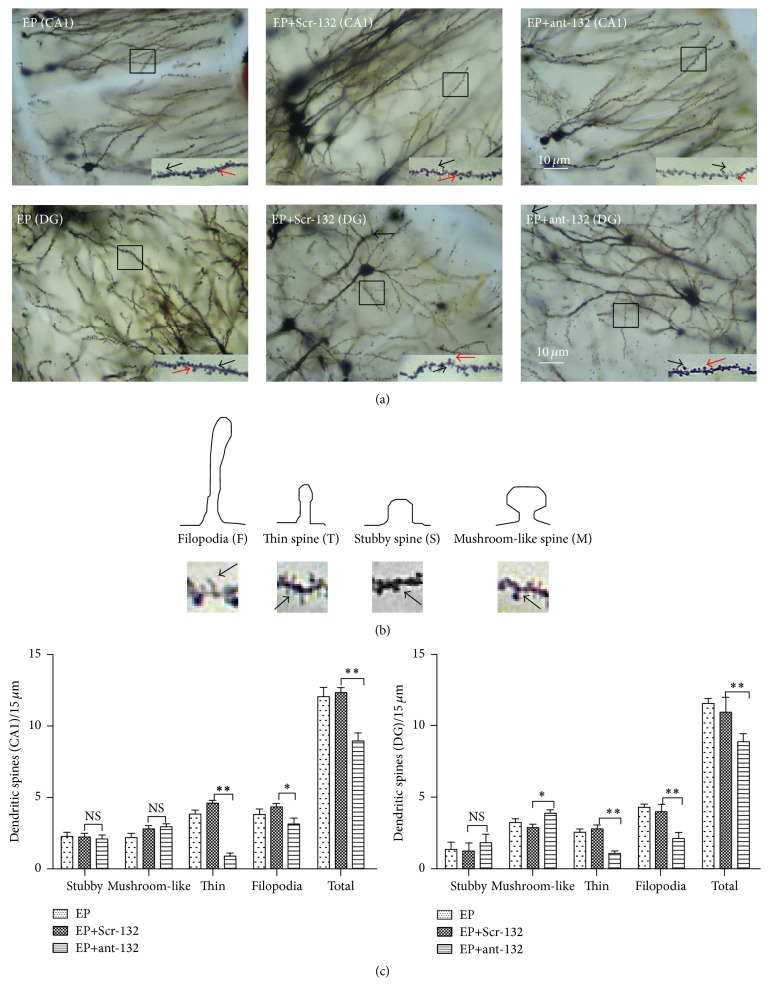
Figure 7.
Golgi-Cox staining of hippocampal brain tissues for visualization of the dendritic spines. (a) Alteration of dendritic spines in the DG and CA1 region of hippocampal neurons visualized using Golgi staining. Scale bar is 10 µm. The red arrows indicate the mushroom-like or stubby spines; black arrows indicate the filopodia or thin spines. (b) Schematic representation of spine classes. (c) Statistical analysis of the total number and different forms of spines between the EP group, EP+ant-132 group, and EP+Scr-132 group. NS p > 0.05, ∗ p < 0.05, and ∗∗ p < 0.01.

