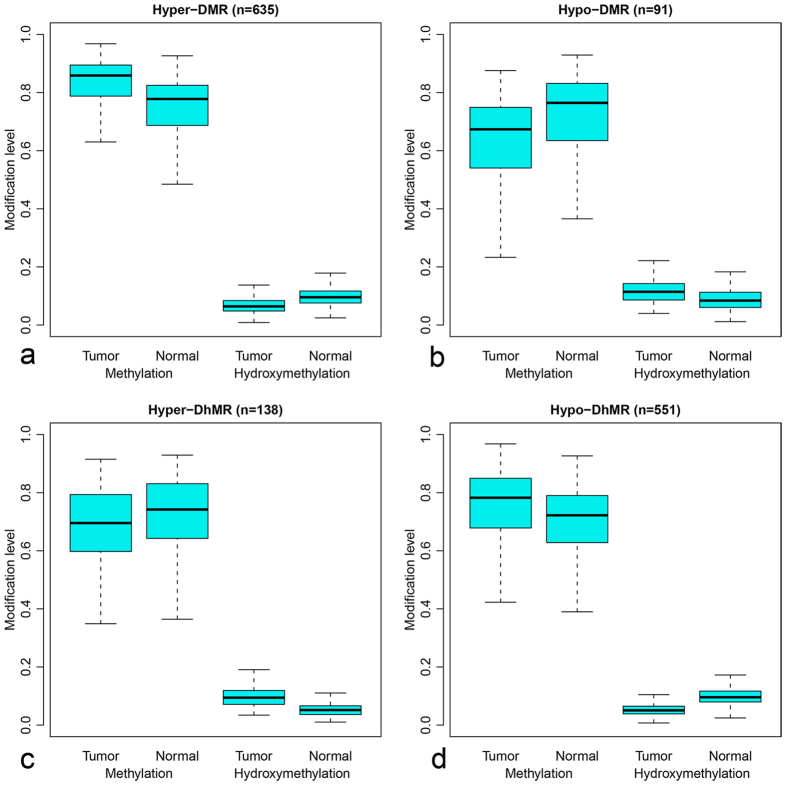
Figure 3. Range of methylation and hydroxymethylation level in DMRs and DhMRs.
The vertical axis shows the abundance of methylation (left) and hydroxymethylation (right) in DMRs or DhMRs. Hyper-DMR (n = 635), loci with higher methylation in CRC group; Hypo-DMR (n = 91), loci with lower methylation in CRC group; Hyper-DhMR (n = 138), loci with higher hydroxymethylation in CRC group; Hypo-DhMR (n = 551), loci with lower hydroxymethylated modification in CRC group; all of these DMRs and DhMRs are confirmed by statistics analysis comparing with normal tissue.

