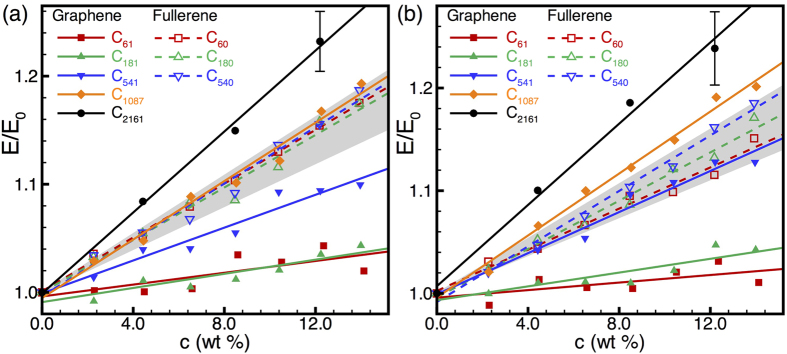
Figure 3.
Normalized elastic modulus, E/E0, of nanocarbon-HDPE composites as a function of filler concentration, c, for (a) HDPE1/C and (b) HDPE2/C parameters. The composite modulus (E) is normalized by the corresponding neat HDPE modulus (E0) in each case. Filled symbols and solid lines indicate graphene-flake fillers, while open symbols and dashed lines indicate fullerene fillers. Straight lines indicate linear fits to the data; each data point corresponds to a statistical average of 30 tensile straining tests but only one typical error bar is shown in each plot to retain clarity. In each case, the shaded region indicates the rather narrow range of moduli spanned by fullerene-reinforced composites. In contrast, graphene reinforcement shows significant filler-size-dependent stiffening.

