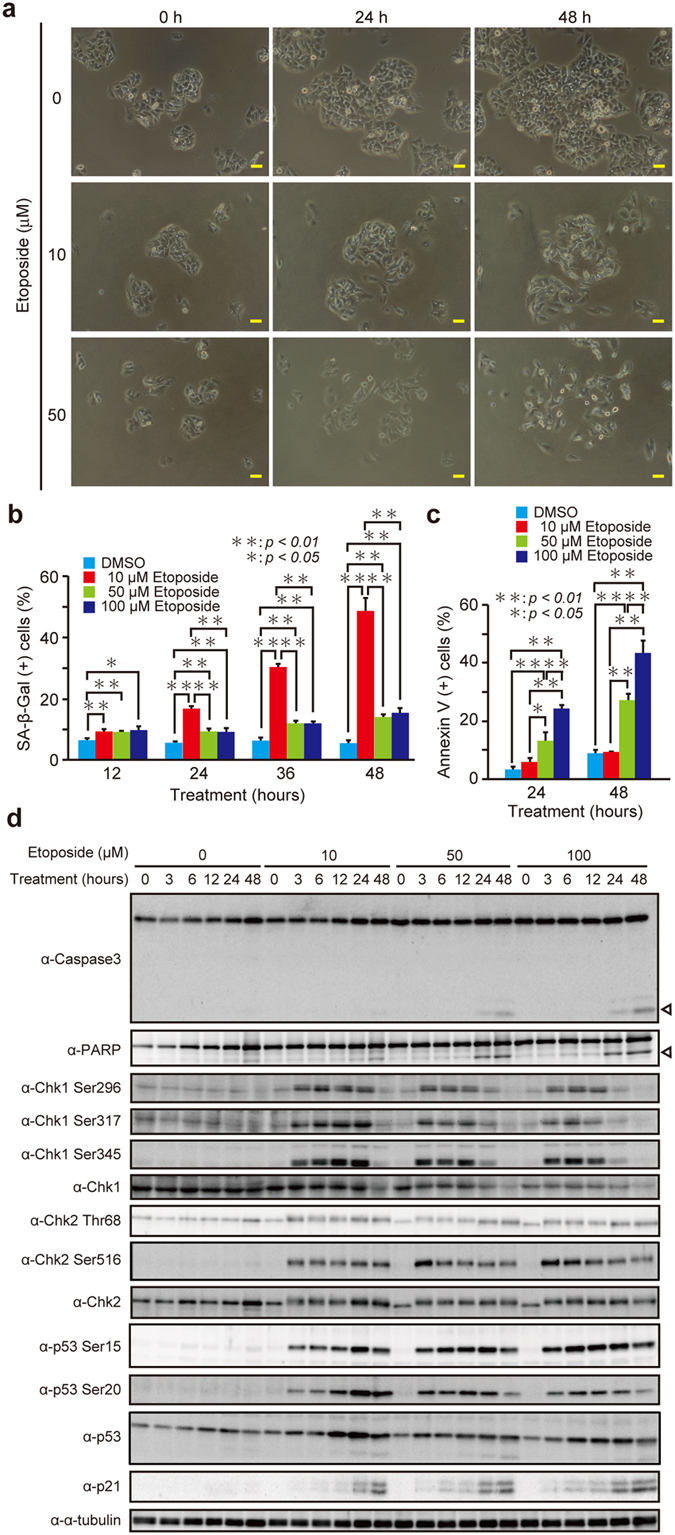
Figure 1. Senescence is induced by the low dose of etoposide, whereas apoptosis is triggered at higher doses in HepG2 cells.

(a) HepG2 cells were treated with 10 and 50 μM etoposide for 24 and 48 h, and observed under microscope. Bars, 50 μm. (b–d) HepG2 cells treated with 10, 50, and 100 μM etoposide for indicated times were subjected to SA-β-Gal staining (b), Annexin V staining (c), or immunoblot analysis (d). Each immunoblot is representative of at least two independent experiments. Arrowheads indicate the cleaved form of the respective proteins. The uncropped images are shown in Supplementary Fig. 5. Data are mean ± SD. Statistical significance is shown using the Student’s t-test analysis (n = 3); *P < 0.05; **P < 0.01.
