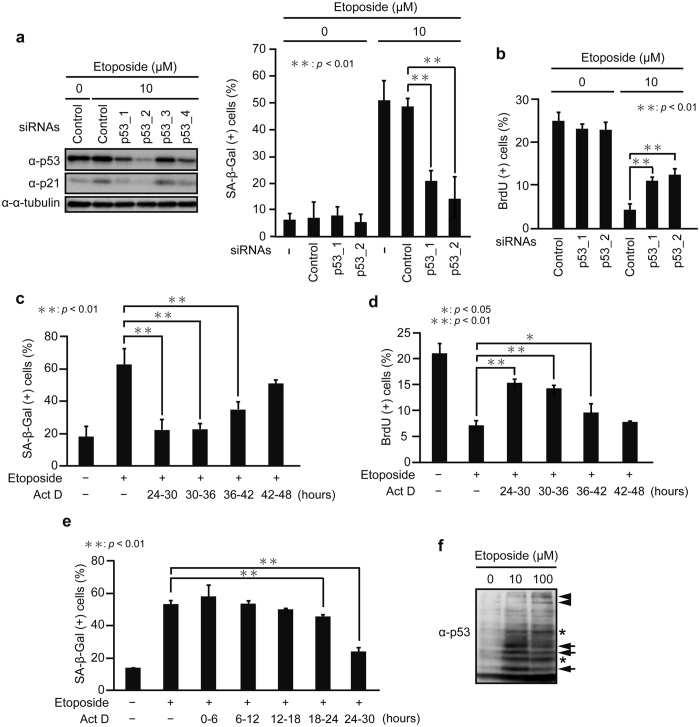
Figure 2. p53 transcriptional activation between 24 h and 36 h after treatment with the low dose of etoposide is required for senescence execution.
(a) HepG2 cells transfected with siRNAs for p53 (p53_1, p53_2, p53_3, and p53_4) were treated with 10 μM etoposide for 48 h. The expression levels of p53 and p21 were determined by immunoblot analysis (left), and the percentage of SA-β-Gal-positive cells was quantified (right). The uncropped images are shown in Supplementary Fig. 6a. (b) HepG2 cells treated as in (a) were subjected to BrdU incorporation assay, and the percentage of BrdU-positive cells was quantified. (c,d) HepG2 cells were treated with 10 μM etoposide for various times (24, 30, 36, and 42 h), and then Act D was added to the medium at a concentration of 50 ng/ml. After 6 h of incubation in the presence of Act D and etoposide, the drugs were washed out by replacing the medium, and the cells retreated only with etoposide up to for 48 h after initial exposure to etoposide were subjected to SA-β-Gal staining (c) and BrdU incorporation assay (d). (e) HepG2 cells cultured as in (c) but treated with Act D during 0–30 h after etoposide exposure as indicated were subjected to SA-β-Gal staining. (f) Lysates from HepG2 cells treated with 10 and 100 μM etoposide for 24 h were subjected to Phos-tag SDS-PAGE and immunoblotted with the anti-p53 antibody. Arrows indicate the bands showing stronger signals at 10 μM than 100 μM etoposide, and arrowheads depict the bands with stronger signals at 100 μM than 10 μM etoposide. Asterisks indicate the bands with no difference between low and high doses of etoposide. The uncropped images are shown in Supplementary Fig. 6b. Data are mean ± SD. Statistical significance is shown using the Student’s t-test analysis (n = 3); *P < 0.05; **P < 0.01.

