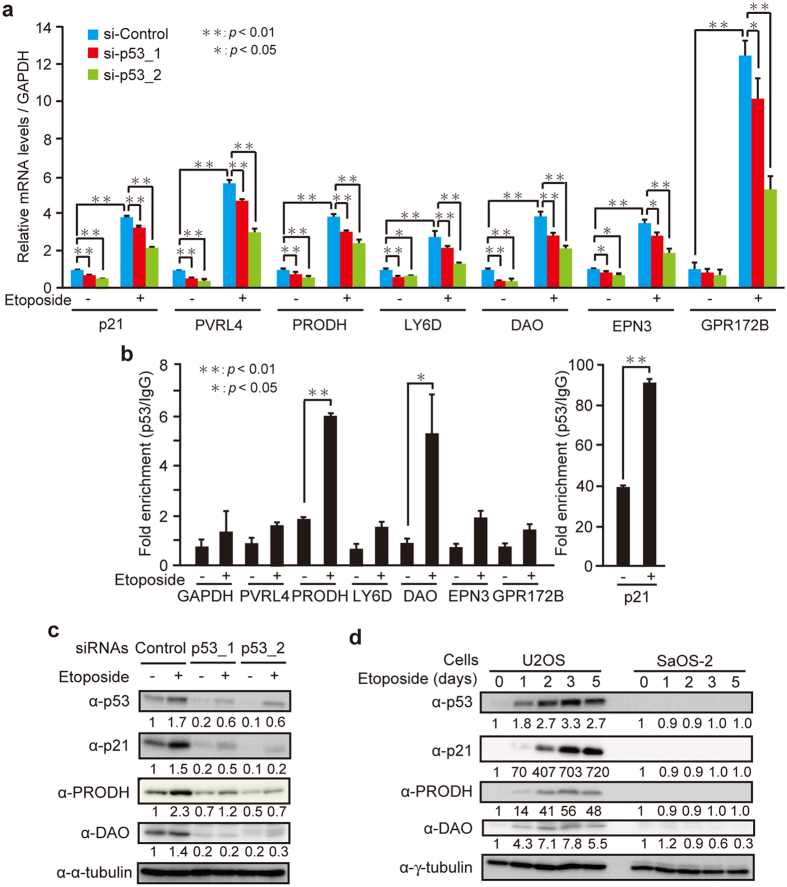
Figure 3. PRODH and DAO are identified as direct transcriptional targets of p53.
(a) Relative mRNA levels of indicated genes in HepG2 cells transfected with p53 siRNAs (p53_1 and p53_2) and treated with 10 μM etoposide for 30 h were determined by qPCR. (b) HepG2 cells treated with 10 μM etoposide for 30 h were subjected to ChIP assay with the anti-p53 antibody. The fold enrichment of p53 over normal IgG was determined by qPCR. (c) HepG2 cells were transfected with siRNAs for negative control (Control) and p53 (p53_1 and p53_2). After incubation for 48 h, the cells were treated with 10 μM etoposide for 30 h, and the levels of indicated proteins were determined by immunoblot analysis. The protein levels relative to the α-tubulin level were quantified using NIH ImageJ software and are indicated at the bottom of each lane. The uncropped images are shown in Supplementary Fig. 7a. (d) U2OS and SaOS-2 cells were treated with 2 μM etoposide for 1, 2, 3, and 5 days, and the levels of indicated proteins were determined by immunoblot analysis. The protein levels relative to the γ-tubulin level were quantified as in (c). Protein levels at day 0 in U2OS and SaOS-2 cells were normalized to 1, respectively. The uncropped images are shown in Supplementary Fig. 7b. Data are mean ± SD. Statistical significance is shown using the Student’s t-test analysis (n = 3); *P < 0.05; **P < 0.01.

