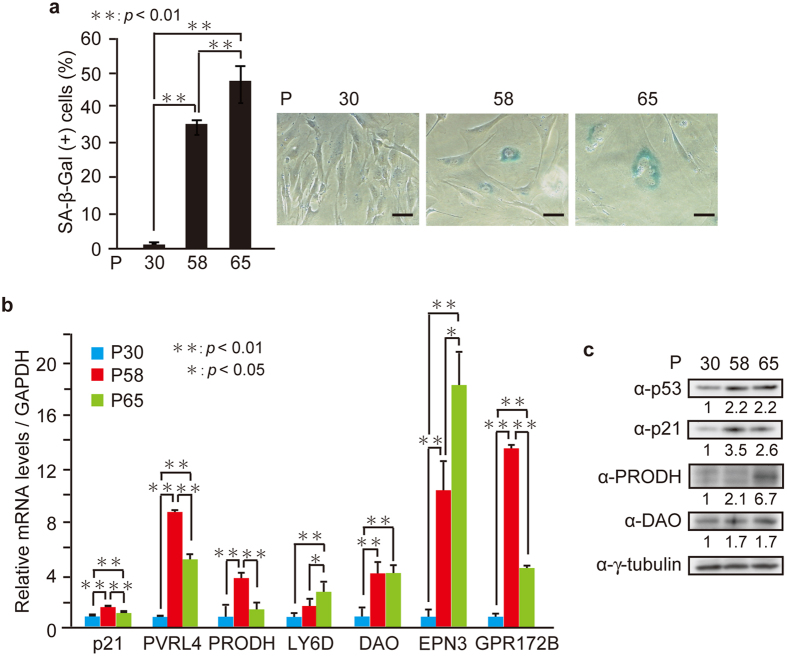
Figure 4. The identified genes are induced during replicative senescence in Hs68 cells.
Hs68 cells at passage numbers 30, 58, and 65 (P30, P58, and P65) were subjected to SA-β-Gal staining (a), qPCR (b), and immunoblot analysis (c). (a) The percentage of SA-β-Gal-positive cells (left) and representative images (right) are shown. Bars, 50 μm. (b) Relative mRNA levels of indicated genes are shown. (c) The protein levels relative to the γ-tubulin level were quantified using NIH ImageJ software and are indicated at the bottom of each lane. The uncropped images are shown in Supplementary Fig. 8. Data are mean ± SD. Statistical significance is shown using the Student’s t-test analysis (n = 3); *P < 0.05; **P < 0.01.

