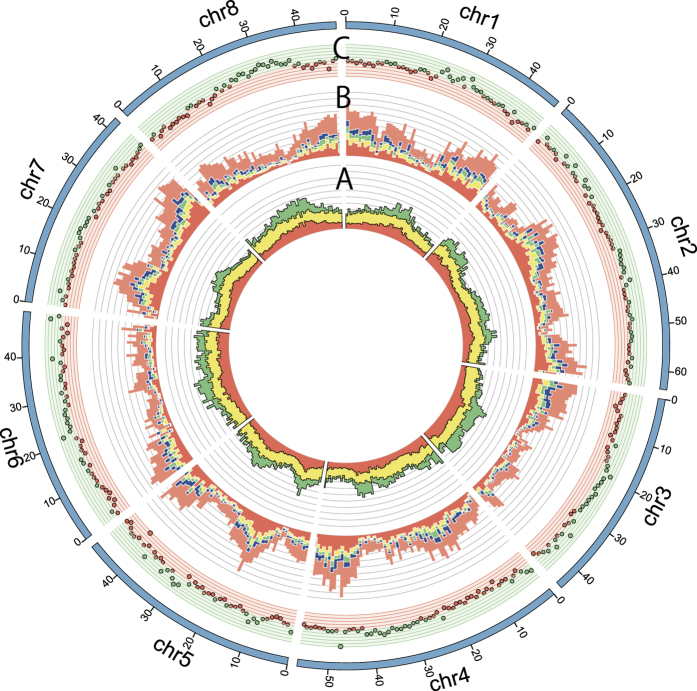
Figure 3. Graphical view of the subterranean clover genome structure.
(A) Ratios of repetitive sequences in 1 Mb window. Red bars represent known repeats. Yellow bars show unique repeats commonly observed in the legume species, red clover, M. truncatula, L. japonicus and common bean, while green bars represent subterranean clover-specific sequences. The distance between horizontal lines shows 10% (B) Numbers of putative subterranean clover genes in a 1 Mb window. Red bars represents subterranean clover genes clustered with each of the other four legume species (red clover, M. truncatula, L. japonicus and common bean), yellow bars with three of the four species, green bars with two of the four species, and blue bars with only one of the species, while orange bars show subterranean clover-specific genes. The distance between horizontal lines represents 20 genes. (C) CNV distribution. Green and red dots show log2 ratio plus and minus values, respectively. The distance between horizontal lines represent log2 ratio of 0.1.

