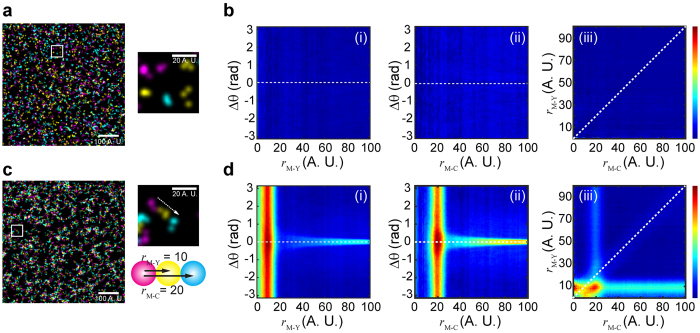
Figure 2. Triple-Pair-Correlation resolves simulated molecular pattern in highly dense SR image.
(a) Simulated molecules that randomly distribute in all the three channels. (b) Triple-Pair-Correlation maps of simulated images of (a) displays no spatial correlation between molecules from all the three channels. (c) Simulated molecules that linearly arrange into a certain sequential pattern. (d) Triple-Pair-Correlation analysis well resolved the internal spatial organization of molecular complex in (c) (Supplementary Figure S1). The feature appearing at  ,
,  is a residual signal arising from the indirect bispectrum calculation (Supplementary Note 2), and accordingly can be subtracted as such. Color bar from blue to red represents low to high correlation amplitude, respectively. Images shown in (a,c) were Gaussian blurred for display purpose.

