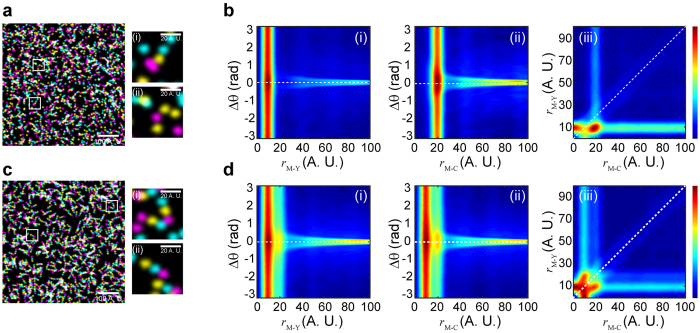
Figure 3. Two scenarios of simulated SR images that contain heterogeneous molecular complex.
(a) Simulated SR image that contains ~49% spatially arranged molecular complex (i) and ~51% randomly distributed molecules (ii). (b) Triple-Pair-Correlation maps of simulated images of (a), succeeding in resolving the spatial organization of the molecular complex from randomly distributed molecules. (c) Simulated SR image that contains ~50% M-Y-C pattern (i) and ~50% M-C-Y pattern (ii). (d) The Triple-Pair-Correlation analysis well resolved the heterogeneity of molecular complex with different internal organization (Supplementary Figure S5). Color bar from blue to red represents low to high correlation amplitude, respectively. Images shown in (a,c) were Gaussian blurred for display purpose.

