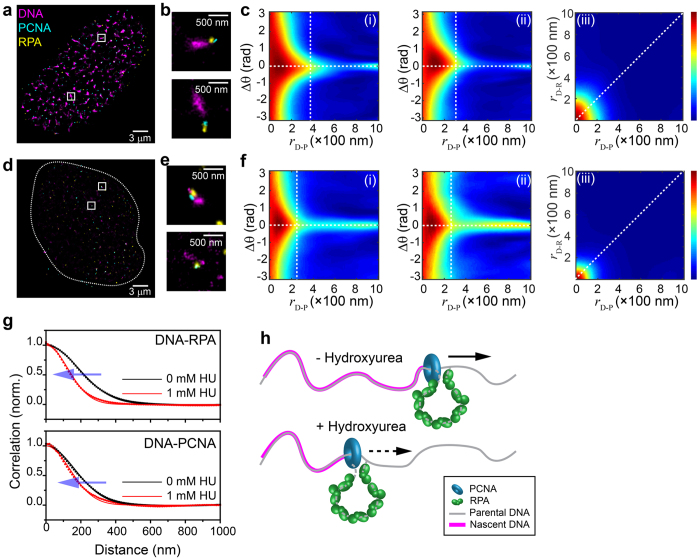
Figure 4. Triple-Pair-Correlation analysis of the SR resolved spatial arrangement of replisomes in cells.
(a) Mutlicolor SR image of a U2OS cell nucleus in early S-phase with nascent DNA, PCNA, and RPA stained in magenta, cyan, and yellow, respectively. (b) Two magnified images showing examples of the internal spatial organization of a replication focus. The experimental localization accuracies for the different colors used in these measurements are: 15 nm, 37 nm, and 44 nm for magenta (Alexa Fluor 647), yellow (Alexa Fluor 568), and cyan (Alexa Fluor 488), respectively (see Data Analysis in Methods section). (c) Triple-Pair-Correlation maps obtained by averaging the Triple-Correlation of 13 nuclei. Distances from DNA to RPA (rD−R) and from DNA to PCNA (rD−P) are ~149.7 ± 0.6 and 132.0 ± 0.7 nm, respectively; angles in between rD−R and rD−P follows a Gaussian distribution centering at 0 with standard deviation of ~29 deg. (Supplementary Figure S6). (d) Mutlicolor SR image of a U2OS cell nucleus treated with 1 mM HU in early S-phase. (e) Two magnified images showing examples of the internal spatial organization of a replication focus under replication stress. (f) Triple-Pair-Correlation maps obtained by averaging the Triple-Pair-Correlation of 18 nuclei. Distances from DNA to RPA (rD−R) and from DNA to PCNA (rD−P) are ~100 ± 1 and 109 ± 1 nm, respectively. Angles in between rD−R and rD−P follows a Gaussian distribution centering at 0 with standard deviation of ~20 deg. (Supplementary Figure S8, all errors are propagated fitting errors). (g) 1D correlation of rD−R (top) and rD−P (bottom) obtained via integration of rD−R − rD−P correlation map (c(iii),f(iii)) along rD−P and rD−R, respectively. Both graphs display a decrease of correlation distances when cells treated with 1 mM HU. Dots and lines represent the raw data and modified Gaussian fit, respectively (Supplementary Note 3). We note that the overlapped portion between nascent DNA and replisome proteins resulted in a high Triple-Correlation response at rD−R (or rD−P) of ~0 nm covering all  , which further resulted in a high correlation at
  (or
(or  ) of ~0 nm after integration through
  in (c(iii),f(iii),g) (Supplementary Note 3 and Supplementary Figure S7). (h) Schematic illustration of the internal organization of a single replication fork obtained from the TPC analysis. Straight and Dashed arrows represent regular and stalled replication processing, respectively.

