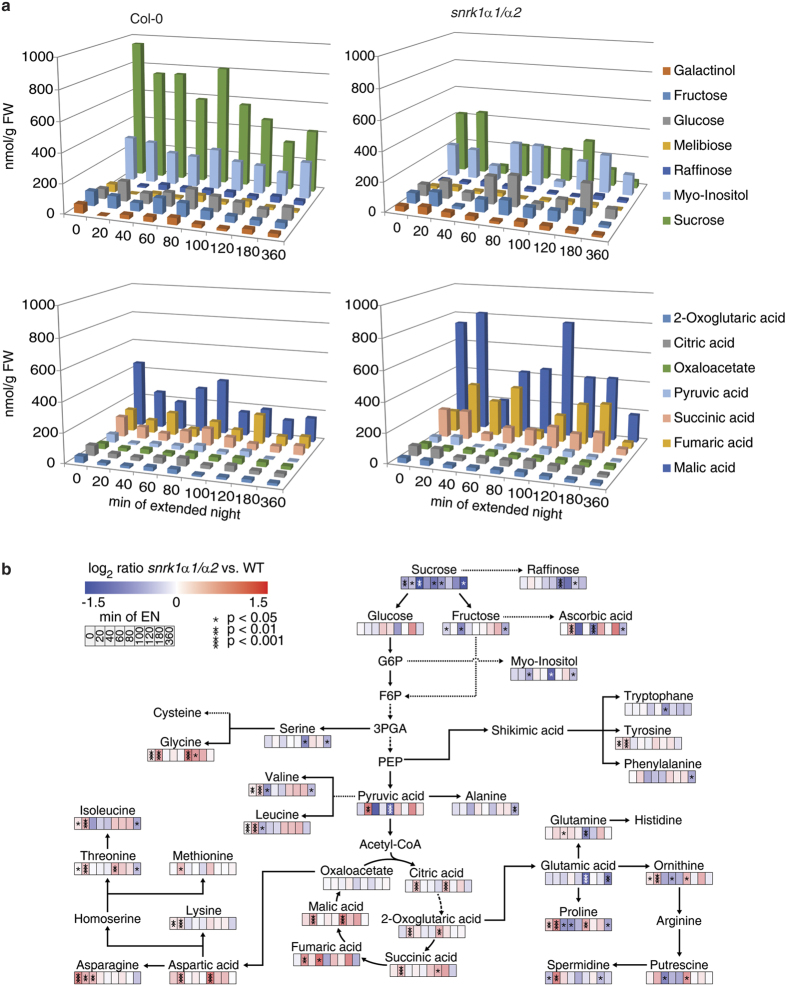
Figure 9. Changes in metabolite concentrations in wild type and snrk1α1/α2 mutant plants under extended night conditions.
(a) Sugars and TCA cycle intermediates show an inverse behaviour in the wild type and snrk1α1/α2 mutant (n = 5). Sugars are lower and TCA cycle intermediates are higher concentrated in the mutant compared to the wild type. This indicates an impaired crosstalk of cytosolic and mitochondrial metabolism in the mutants. (b) Ratios of significantly changed metabolite levels during an extended night time course in the snrk1α1/α2 mutant versus wild type. According to the colour bar, colours indicate the log2 value of the ratios which were built from absolute mean levels determined for snrk1α1/α2 and wild type (n = 5). Ratios were built according to the formula snrk1α1α2/wild type. Asterisks indicate significant differences between metabolite levels (*p < 0.05, **p < 0.01, ***p < 0.001). A detailed overview of absolute metabolite levels and standard deviations is provided in the Supplementary Table S4.

