
Figure 1. Effect of thymoquinone (TQ) on Schwann cell proliferation induced by high glucose.
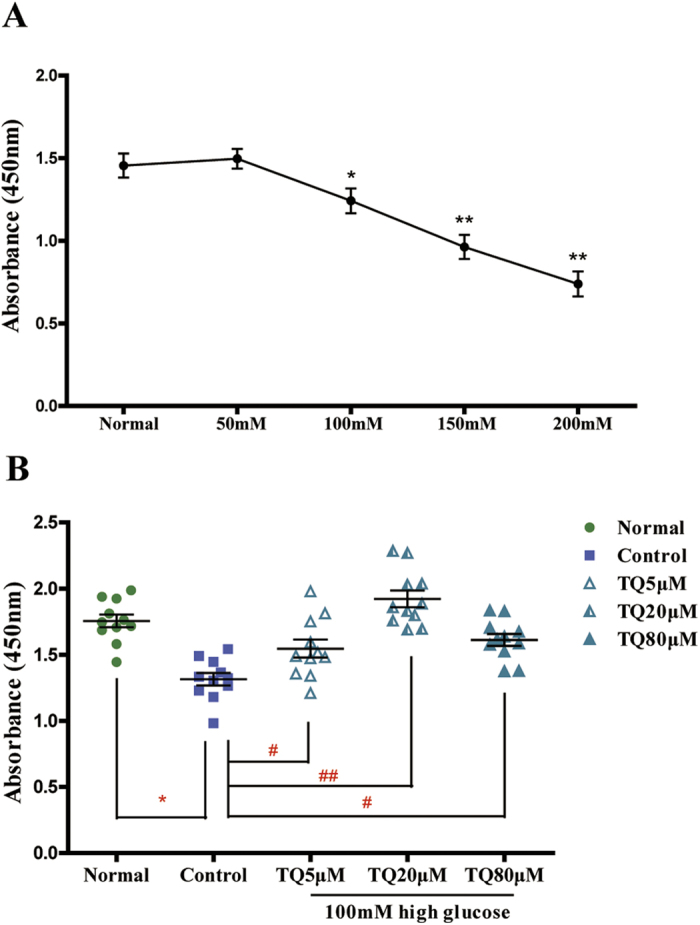
(A) RSC96 cells were treated with 25 (the normal group), 50, 100, 150, or 200 mM high glucose for 24 h. *p < 0.05, **p < 0.01 versus normal group. (B) RSC96 cells were induced by 100 mM high glucose and treated with 0, 5, 20, or 80 μM TQ for 24 h. Cells in the normal group were treated with 25mM glucose for 24 h. *p < 0.05 versus the normal group, #p < 0.05 versus control group, ##p < 0.01 versus control group.