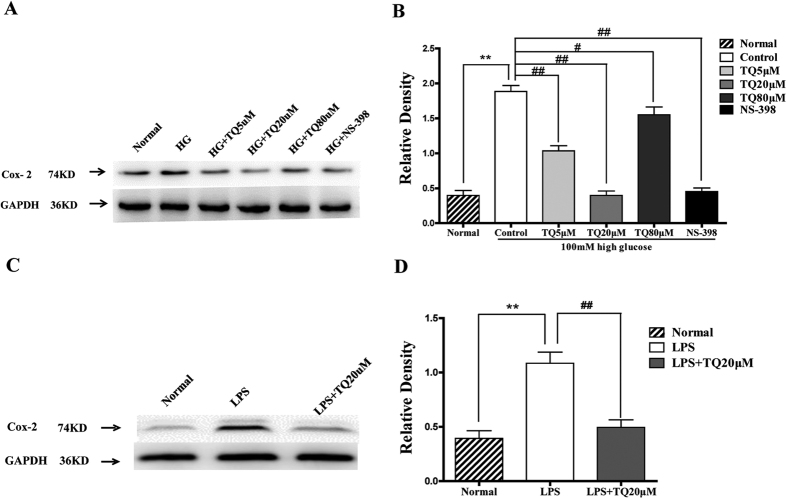
Figure 3. Thymoquinone (TQ) decreased the expression of COX-2 induced by high glucose and lipopolysaccharide (LPS).
(A,B) RSC96 cells were induced by 100mM glucose for 24 h, then cells were treated with 5, 20, or 80 μM TQ and 10 μM NS-398 for 24 h. (A) A representative western blot of COX-2 is shown. HG: high glucose. (B) The relative density of COX-2 expression. **p < 0.01 versus the normal group; #p < 0.05 versus the control group, ##p < 0.01 versus the control group. (C,D) RSC96 cells were induced by 1 μg/L LPS and treated with 20 μM TQ for 24 h. (C) A representative western blot of COX-2 is shown. (B) The relative density of COX-2 expression. **p < 0.01 versus the normal group; ##p < 0.01 versus the control group.

