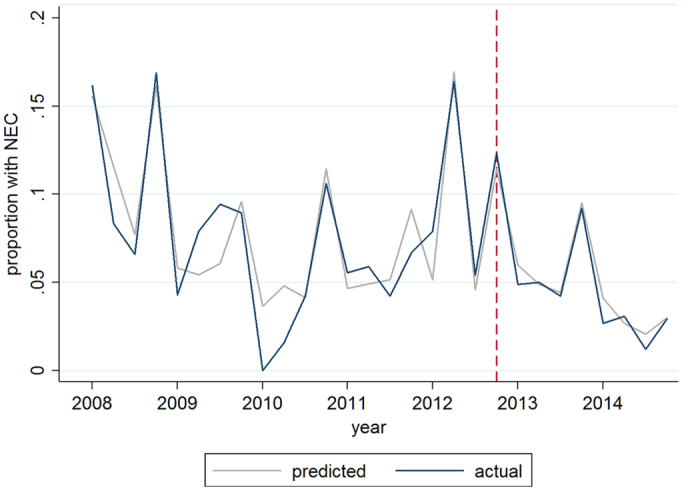
Figure 2. Quarterly incidence of NEC 2008–2014.

The actual incidence, plotted in blue, reflects the observed proportion of infants developing NEC in the studied population, showing seasonality in NEC incidence. Red dotted line indicates moment of introduction of routine probiotics. The predicted incidence, plotted in grey, represents the estimated incidence of NEC by the interrupted time series model, with adjustment for gender, gestational age, birth weight Z-score, mode of delivery, prenatal steroids, (interaction between probiotic introduction and feeding type), type of feeding, seasonality and non-linear time trend.
