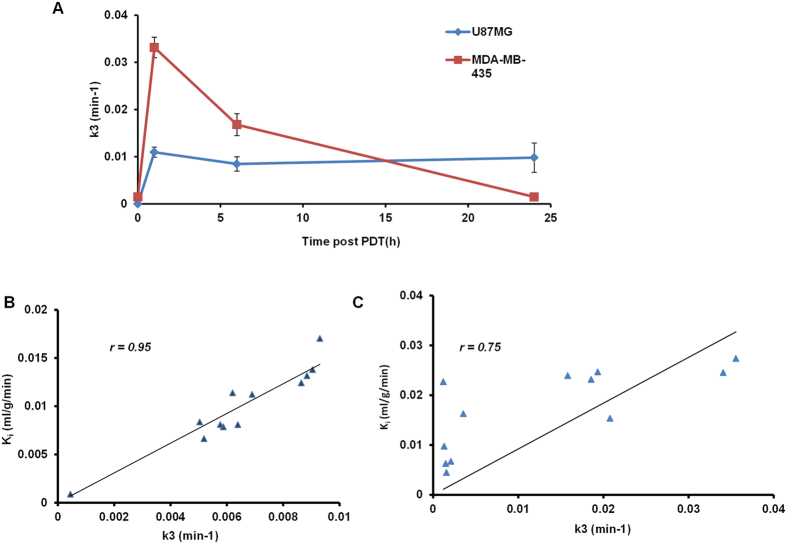
Figure 2.
(A) Comparison of the mean k3 values (min−1) of the tumor ROI for U87MG and MDA-MB-435 tumor models, before and 1, 6, 24 h after PDT treatment. (B) Correlation between the kinetics parameters Ki and k3 calculated from all time points for U87MG model, with Pearson correlation coefficient r. (C) Correlation between the kinetics parameter Ki and k3 for MDA-MB-435 model, with Pearson correlation coefficient r.

