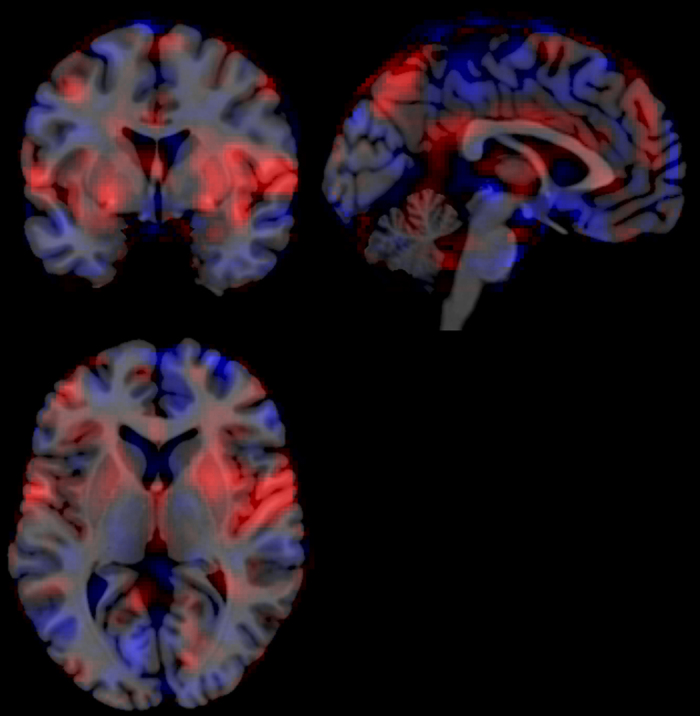
Figure 2. Multivoxel pattern for the prediction of noxious heat temperatures.

An illustration of the predictive linear regression coefficients used to predict noxious heat temperatures from whole-brain fMRI images. The weight maps were trained and cross-validated with data from the parallel experiment, using a LASSO-PCA43 approach. Red voxels denote positive predictive weights and blue voxels negative predictive weights; the weight magnitude is implied by colour saturation (range: 8.14*10−4 to −5.35*10−4, arbitrary units). Signal increases in red areas and signal decreased in blue areas both result in increased multi-voxel heat estimates. Areas with high saturation contribute strongly to the prediction, whereas areas with low saturation have little influence. Slices are taken at MNI coordinates (x = −2, y = 2, z = 5).
