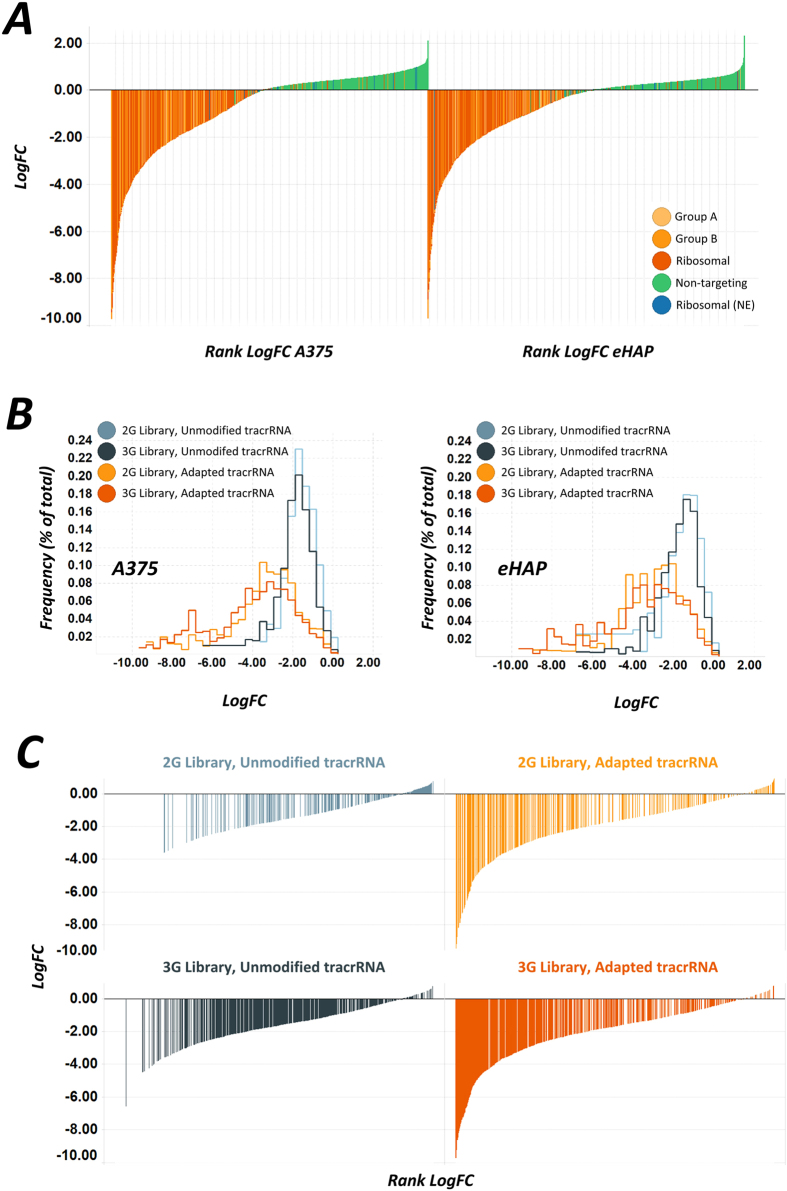
Figure 2. Evaluation of CRISPR–Cas9 Screening in haploid and hypotriplod cell lines reveals distinct responses in screen performance using an adapted tracrRNA sequence.
(A) Log2 fold change (LogFC) of control guides in the screening for each cell line is shown determined between T1 and T3 samples (see methods). Guides targeting essential genes are shown in orange, and negative control guides are shown in blue and green. Genes within each group are shown in Table S1 (Supplementary Information) (B). Distribution plots of essential guides in each library (2G and 3G) and each tracrRNA variant (unmodified and adapted), showing the LogFC as a percentage of the guides in each group. Inactive guides score close to zero, and are found with lower frequency in the adapted tracrRNA screen and in the 3G library. (C) Waterfall plots for individual guide LogFC scores in A375 cells plotted for each library and each tracrRNA variant showing the rank of each guide within each set for side-by-side comparison of the distributions within each dataset.

