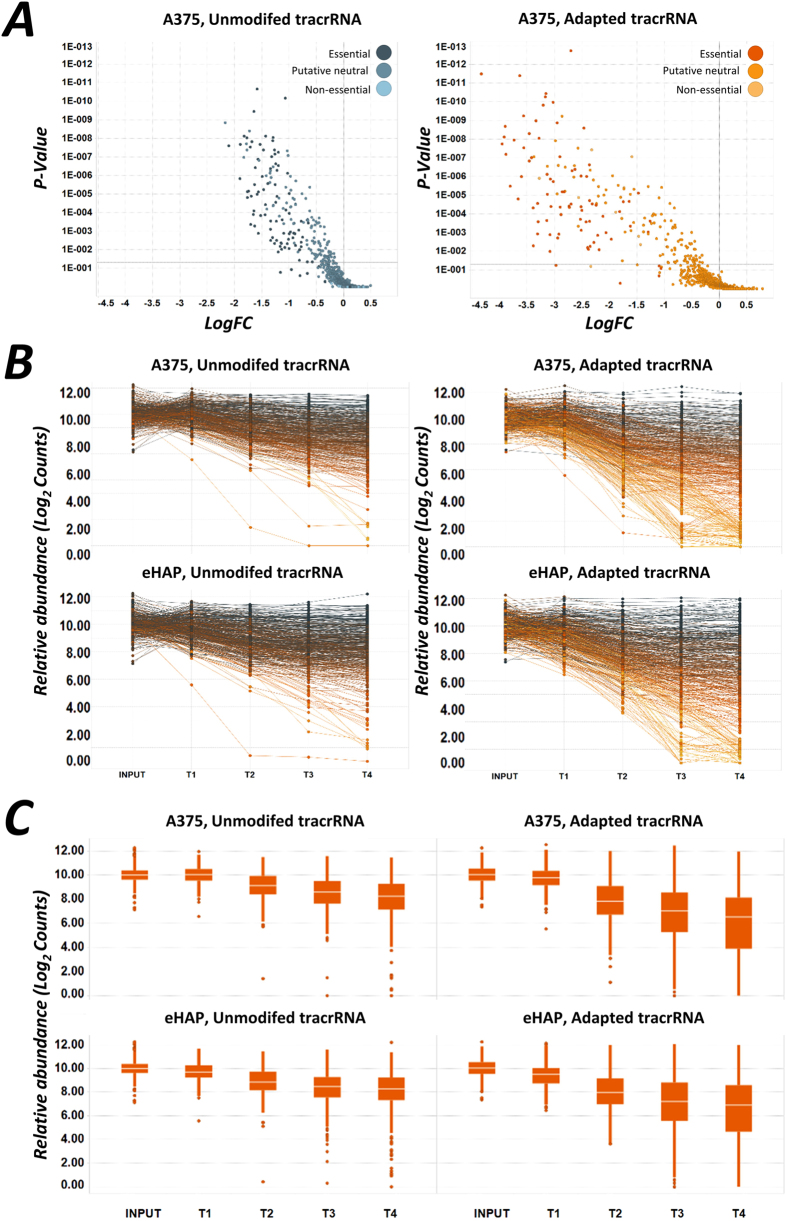
Figure 4. Kinetic analysis of CRISPR–Cas9 screening indicates that gene essentially can be manifested at an early time-point following infection with Cas9.
(A) Volcano plots from one-tailed analysis using the RRA analysis (p-value) algorithm for each of the genes in the two tracrRNA datasets8. (B) Comparison of the relative abundance in Log2 sequence counts at each time point measured for essential gene guides in each group. Colours indicate the LogFC for each guide from, where yellow is the maximum and dark blue in the minimum. T1 samples were taken after 72 hours after transduction, T2 after seven days, T3 was taken 12 doublings after T2 and T4 was taken 24 doublings after T2. (C) Box plots for the time-resolved data shown in A, indicating that no major overall difference in screen characteristics was observed between eHAP and A375 cells.

