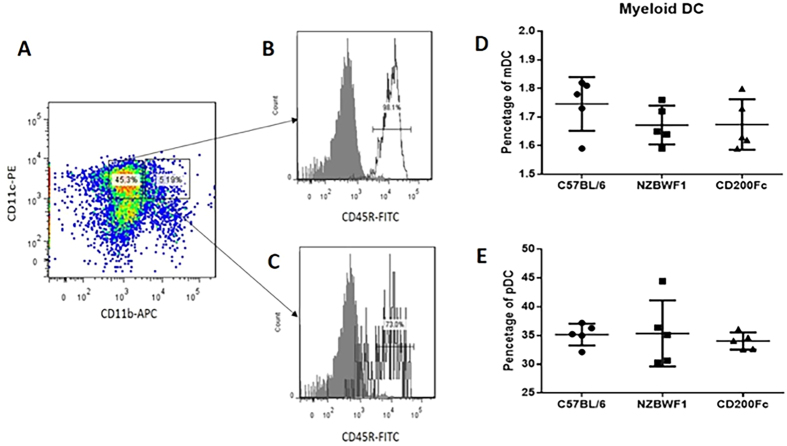
Figure 4. The percentage of two subsets of dendritic cells in the splenocytes of NZB/WF1 and C57BL/6 mice.
(A,B,C) Gating of CD11b+CD11chighCD45R− mDCs and CD11b-CD11cinterm.CD45R+ pDCs. Open histogram: mAb against CD45R; gray histogram: IgG control. (D) Percentages of mDCs in splenocytes of C57BL/6 and NZB/WF1 mice and of NZB/WF1 mice treated with CD200-Fc. (E) Percentages of pDCs in splenocytes of C57BL/6 and NZB/WF1 mice and of NZB/WF1 mice treated with CD200-Fc. The means and interquartile ranges are depicted as solid lines.

