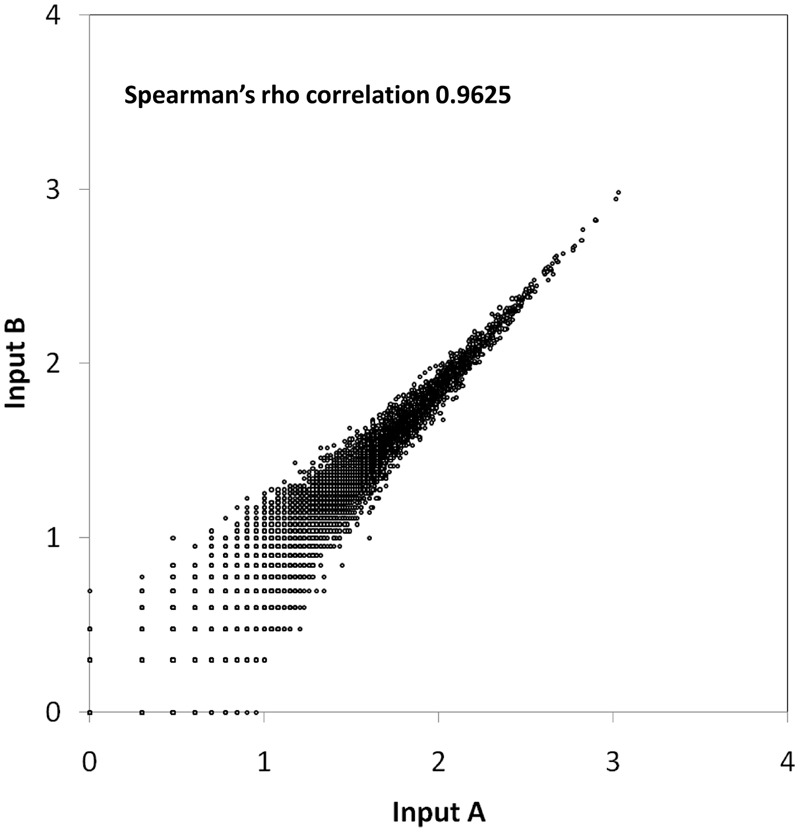
FIGURE 1.

Scatter plot showing the correlation between two replicates. The number of unique insertions (log10) in each gene from Input A was plotted against Input B. A Spearman’s rho correlation coefficient of 0.9625 indicates low variation between replicates.
