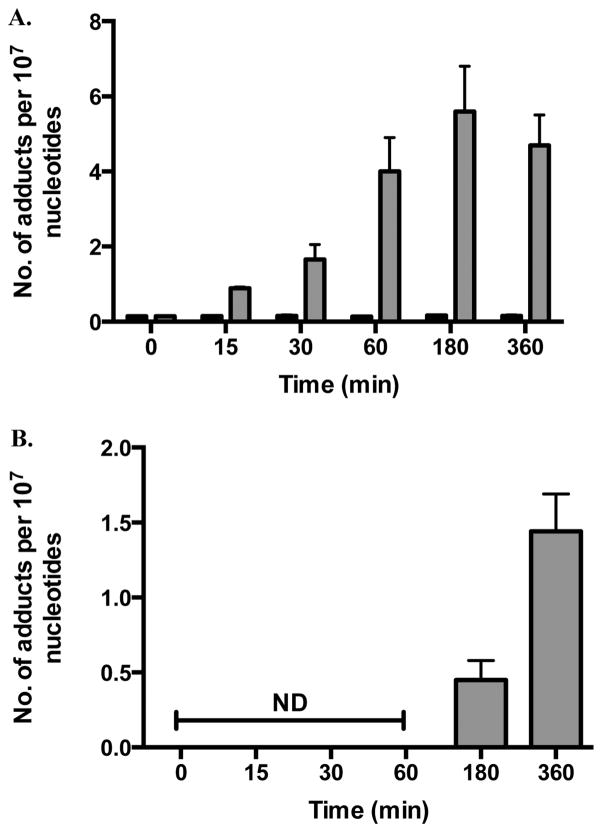
Figure 4.
M1dG and 6-oxo-M1dG levels in RKO cells after treatment with adenine propenal (400 μM) for the indicated times. Data are shown for vehicle-treated (black) and adenine propenal-treated (gray) cells and indicate levels of M1dG (A) and 6-oxo-M1dG (B) in the nucleus. Data represent the mean ± SD of triplicate determinations.

