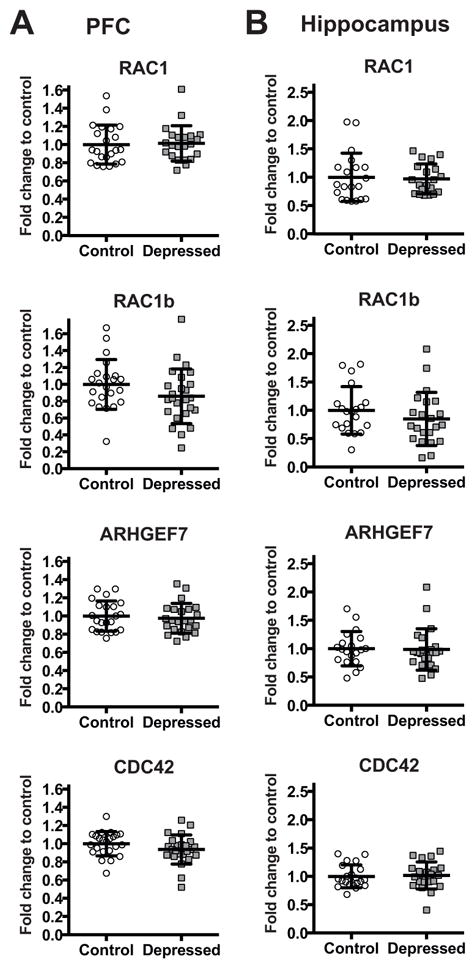
Figure 3.

mRNA levels of RAC1, RAC1B, CDC42, and ARHGEF7 in the PFC (A)and in the hippocampus (B) of non-psychiatric controls (Control: PFC n=22 for RAC1, RAC1B, and ARHGEF7, n=23 for CDC42; Hippocampus n=20 for RAC1, RAC1B, and ARHGEF7, n=21 for CDC42) and depressed subjects (Depressed: PFC n=22 for RAC1, n=25 for RAC1B, n=23 for ARHGEF7, and n=24 for CDC42; Hippocampus n=20 for RAC1, and n=22 for RAC1B, ARHGEF7, and CDC42) normalized to the geometric mean of the three reference targets (GAPDH, CYC1, PPIA). Results are expressed as fold change in mRNA levels. Values are fold change ±SD. No significant differences between the depressed group and the control group were determined for any of the genes.
