
Figure 4. Coordinated expression is altered in the brain of subjects with depression.
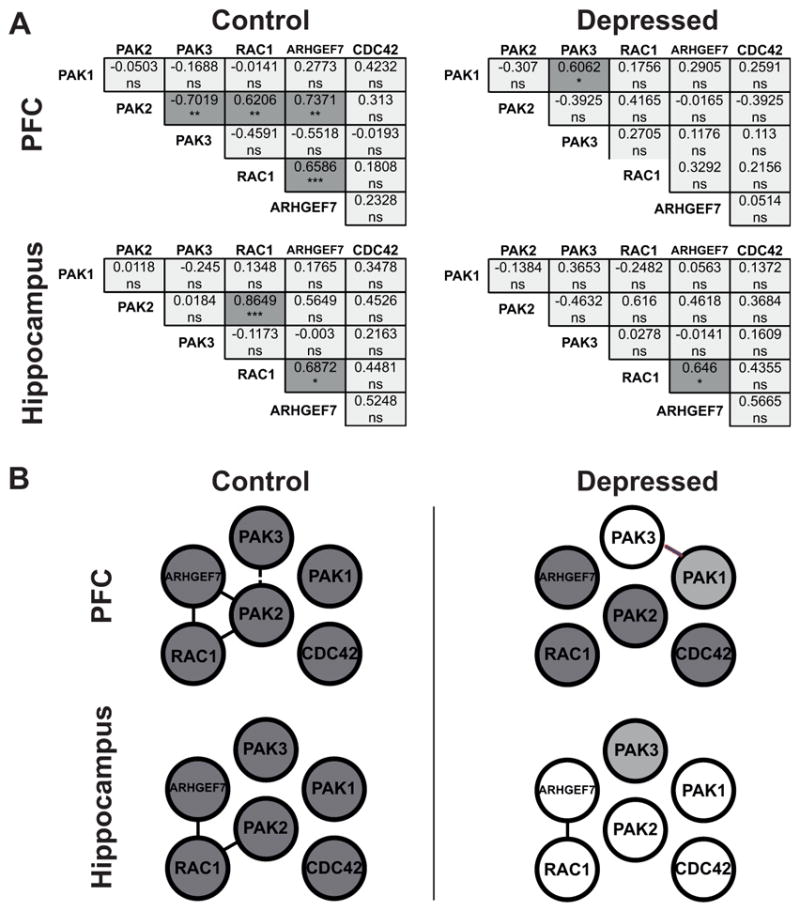
(A) Correlation analysis of mRNA expression levels in the PFC and in the hippocampus In the correlation matrices all pairwise Spearman correlation coefficients calculated on normalized mRNA expression levels are shown. Cross-correlations were performed between the expression level of the 6 different genes for the depression group and for the control group independently in each brain area. This resulted in fifteen separate comparisons for each group in each area. Statistically significant Spearman correlation p values (two-tailed) are indicated by asterisks (Bonferroni corrected significance threshold, after correction: *p<0.05, **p<0.01, ***p<0.001, ns=no significant; dark grey indicates a statistically significant correlation, light grey indicates a non significant correlation). In the PFC and in the hippocampus of depressed subjects, significant correlations appear less frequently than in the control PFC and the control hippocampus. In the PFC, decrease in the frequency of significant correlations between controls and depressed subjects is statistically significant (chi-square=6, *p=0.0143). No statistical difference is detected in the hippocampus (chi-square=1.034, p=0.3091). (B) Network of the gene coexpression pattern in the PFC and in the hippocampus in control and depressed group. Gene pairs that show a significant correlation are indicated: a positive significant correlation (full line); a negative significant correlation (dashed line). Dark circles indicate differentially expressed genes. Differences between control and depressed groups are observed in both tissues.