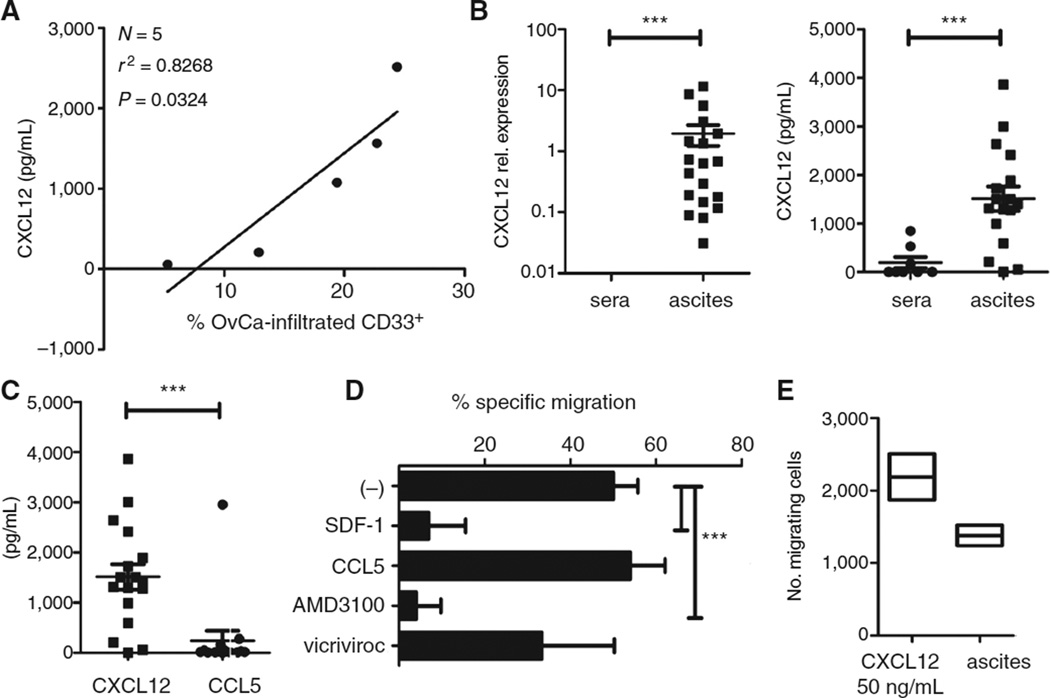
Figure 2.
CXCL12-driven accumulation of cancer-associated monocytic MDSCs. A, correlation between CXCL12 levels and frequency of CD11b+CD33+ cells in ovarian cancer ascites from different patients. The percentage of CD11b+CD33+ cells in ovarian cancer ascites was determined by flow cytometry analysis after staining of ovarian cancer ascites-infiltrating primary cells, harvested from fresh ascites by centrifugation (N = 5 patients). The regression line and corresponding r2 value is shown. OvCa, ovarian cancer. B, CXCL12 expression (left; N=19; vs. N=5) and protein levels (right; N=17; 1509 pg/mL vs. N =8; 193 pg/mL) in ovarian cancer ascites from different patients compared with cancer patient sera. C, CXCL12 versus CCL5 levels in ovarian cancer ascites from 17 different patients. D, specific migration of ovarian cancer–isolated MDSCs to ascites in the absence or presence of CXCR4 antagonist AMD3100, CCR5 antagonist vicriviroc, or CXCL12 and CCL5 desensitized. E, responsiveness of ovarian cancer–isolated MDSCs to rhCXCL12 (50 ng/mL) and ovarian cancer ascites. All data (A–E) were confirmed in 3 to 7 independent experiments. The bars represent cumulative data from 3 to 7 different donors, expressed as mean ± SD. *, P < 0.05; **, P < 0.01; ***, P < 0.001.

