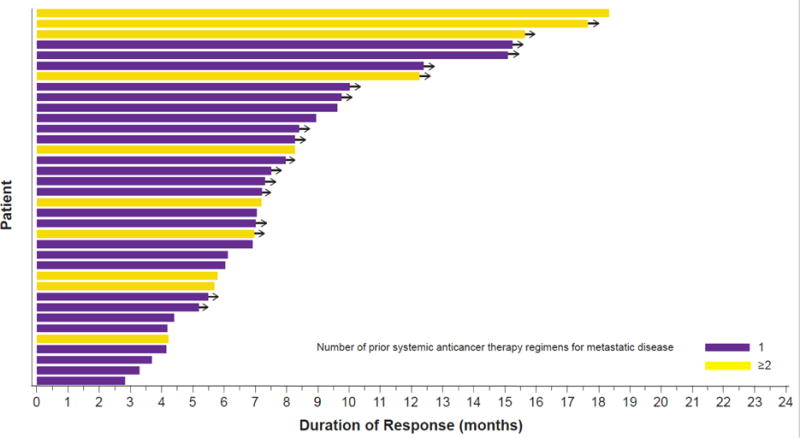
Figure 4. Duration of response (n=36) based on investigator assessment in ≥ second-line patients.

Duration of response by number of prior systemic anticancer therapies for metastatic disease. Yellow bars indicate patients with one prior regimen. Purple bars indicate patients with at least two prior regimens. Arrows denote ongoing response at the time of data cut-off. Note that half (n=18) of the patients had an ongoing response at the time of data cut-off.
