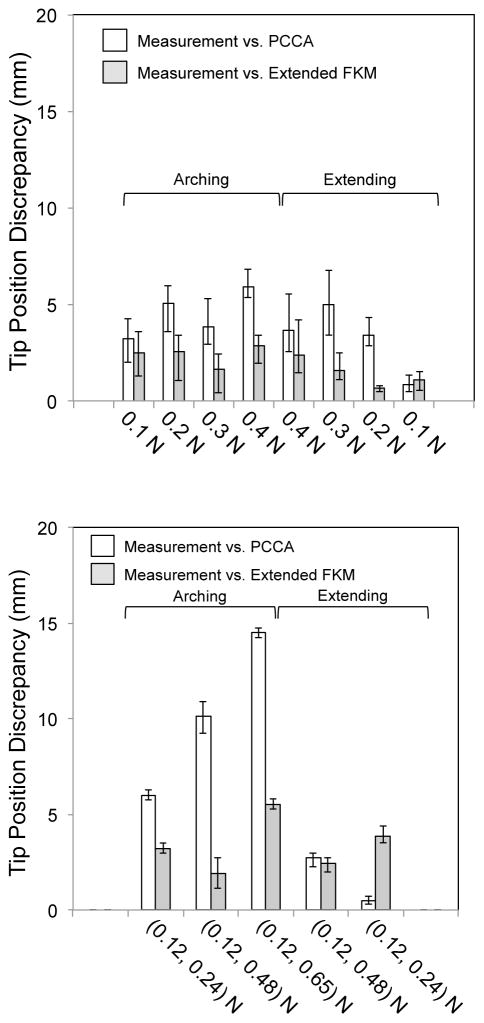
Fig. 12.
Tip position discrepancy for the single-tendon and antagonistic-tendons layouts. White bars signify a discrepancy between the measurement and the values predicted with PCCA. Gray bars indicate discrepancy between the measurement and the values predicted with the extended FKM. (Top) Single-tendon layout. (Bottom) Antagonistic-tendons layout

