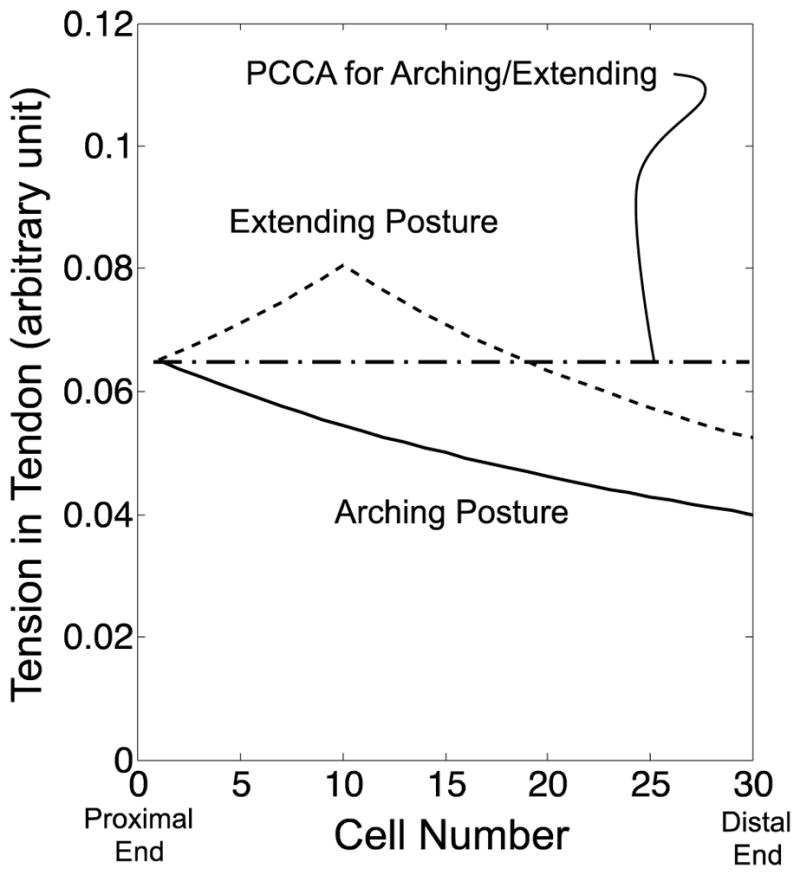
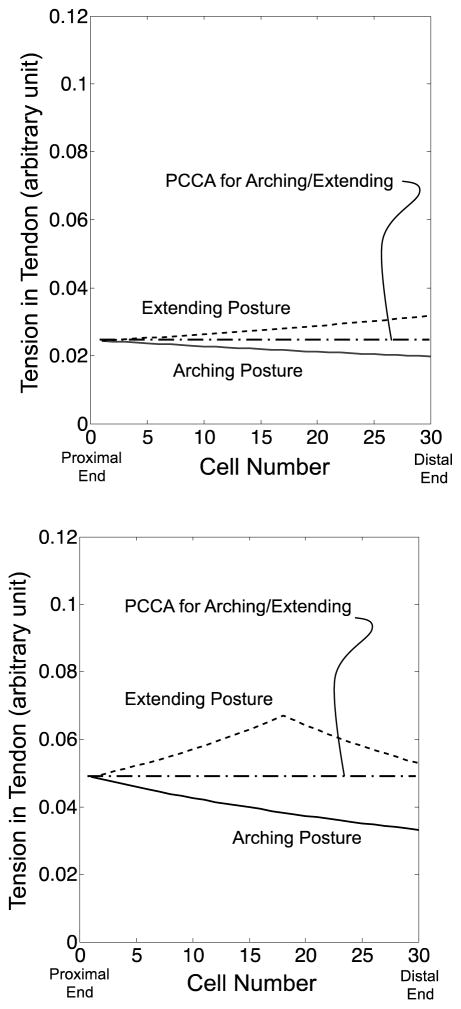
Fig. 15.

Comparison of tension variation at the same input tension between the values calculated by the extended FKM and PCCA. Solid and dotted lines signify the values calculated by the extended FKM in arching and extending motions. An alternate long and short dash line denotes the values calculated by PCCA. (Top) Input tension A. (Center) Input tension B. (Bottom) Input tension C

