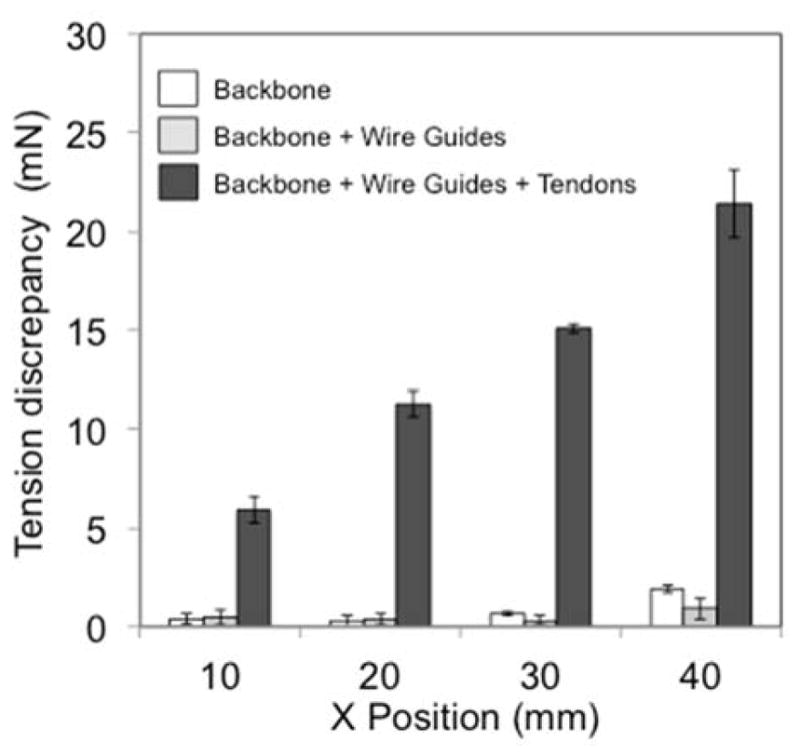
Fig. 5.

Tension discrepancy in three sets of bending bodies. White, light gray, and heavy gray bars signify the backbone, the backbone with the wire guides, and the backbone with the wire guides and the tendons, respectively. The bars denote averages of the tension discrepancy. Error bars indicate maximum and minimum measured values. The backbone with the wire guides and tendons showed a larger tension discrepancy ranging from 5.9 to 21.4 mN, while the backbone with the wire guides ranged from 0.1 to 1.9 mN. Since the backbone ranged from 0.3 to 1.9 mN for the discrepancy, the wire guides did not induce the hysteresis operation from the curve of the backbone
