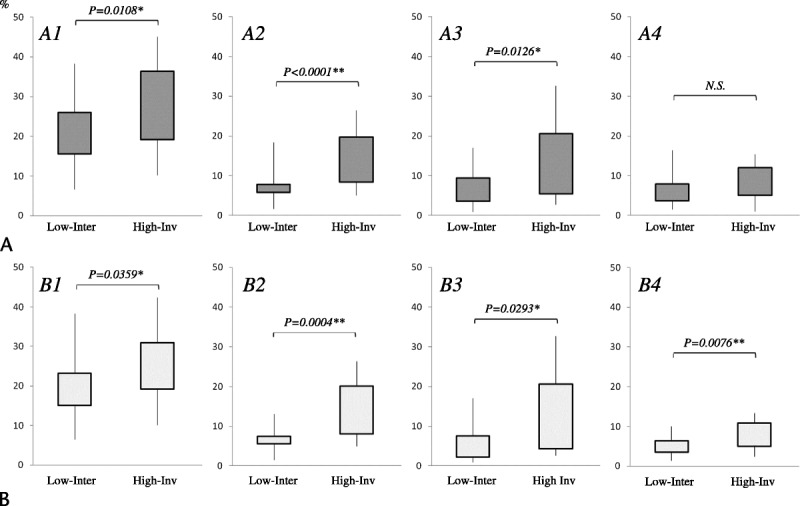
FIGURE 3.

Comparison between the low-inter group and the high-inv group. A1–A4, In all IPMN, the degree of fibrosis (A1) and the rates of immunopositivity for α-SMA (A2) and periostin (A3) are significantly higher in the high-inv group than in the low-inter group. Only the rate of immunopositivity for galectin-1 (A4) showed no significant intergroup difference. B1–B4, Within BD-IPMNs, the degree of fibrosis (B1) and the rates of immunopositivity for α-SMA (B2), periostin (B3), and galectin-1 (B4) are significantly higher in the high-inv group than in the low-inter group. The level of statistical significance was set at *P < 0.05, **P < 0.01.
