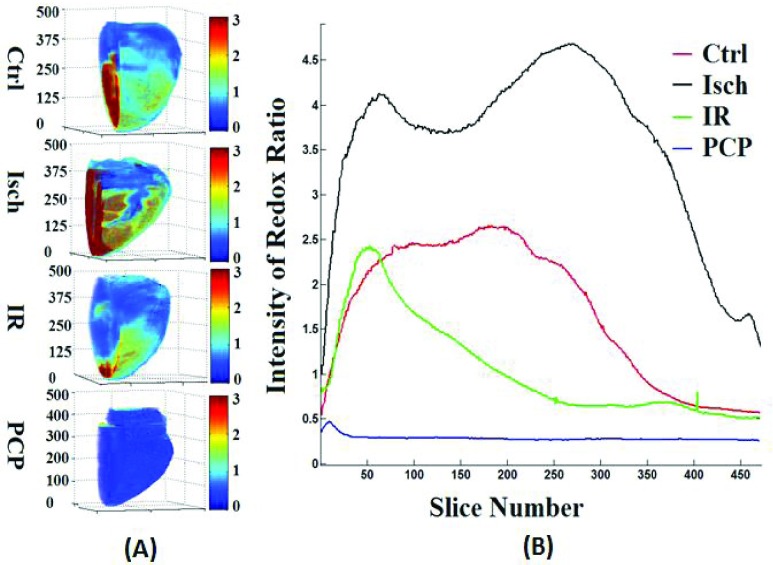
FIGURE 5.
(A) 3D distribution of mitochondrial redox state (NADH/FAD redox ratio) in a mid-sagittal view of the myocardium from the apex (bottom) to the base (top) of a representative heart during the Ctrl (time control TC), ischemia (Isch), ischemia and reperfusion (IR), and PCP treatments. (B) Plot of the volume-averaged redox ratio in approximately 800 different layers of the representative heart from the apex to the base.

