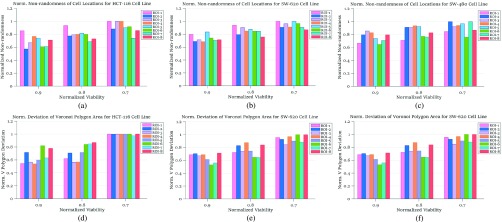
FIGURE 6.
Normalized heterogeneity results among live cell positions: (a), (b) and (c) are from spatial point process, for colorectal cell lines HCT-116, SW-620 and SW-480, respectively, all are under FOLFOX treatment; (d), (e) and (f) are from deviation results among Voronoi polygon areas for colorectal cell lines HCT-116, SW-620 and SW-480, respectively; all are under FOLFOX treatment.

